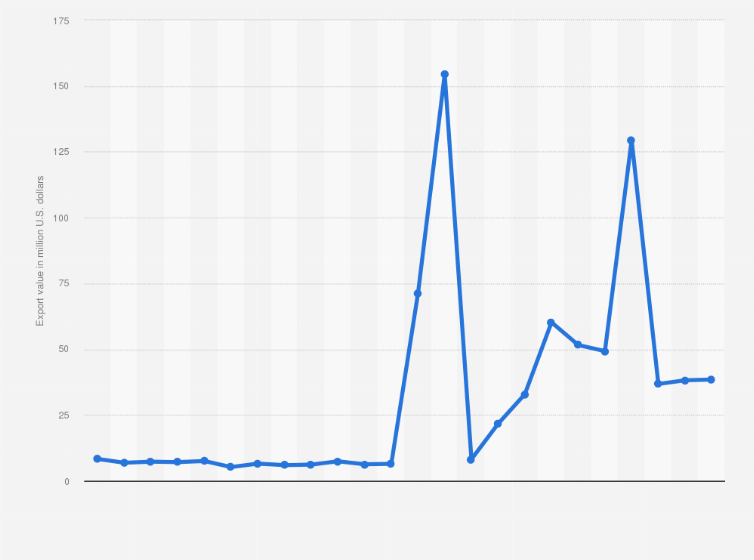
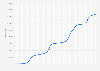
Due to the novel coronavirus (COVID-19) outbreak in the beginning of 2020, exports of face masks grew rapidly. The export value of miscellaneous textile products going by the HS Code 6307909000, which includes face masks, amounted to approximately 154.45 million U.S. dollars in February 2020, showing a year-over-year growth rate of around 2156.2 percent. For comparison, the total export value of such articles was at 80.91 million U.S. dollars for the entire year 2019. Due to the high demand of masks in South Korea, the government urged producers to maximize mask productions, illegalized mask hoarding, and banned exports in the beginning of March.
Monthly export value of other made-up textile products like face masks from South Korea from January 2019 to December 2020
(in million U.S. dollars)
Adjust the presentation of the statistic and data points.
Share the statistic on social media channels or embed the statistic in your
website using "Embed Code", where available.
Cite this statistic and select one of the following formats: APA, Chicago, Harvard, MLA & Bluebook.
Print the statistic including description and metadata.
Chart type
Monthly export value of other made-up textile products like face masks from South Korea from January 2019 to December 2020
Share this statistic
You have no right to use this feature.
Make sure to contact us if you are interested in scientific citation.
You can upgrade your account to enable this functionality for all statistics.
This feature is not available with your current account.Request access
Learn more about how Statista can support your business.
KITA. (January 26, 2021). Monthly export value of other made-up textile products like face masks from South Korea from January 2019 to December 2020 (in million U.S. dollars) [Graph]. In Statista. Retrieved May 04, 2025, from https://www.statista.com/statistics/1102613/south-korea-textiles-like-face-masks-export-value-monthly/
KITA. "Monthly export value of other made-up textile products like face masks from South Korea from January 2019 to December 2020 (in million U.S. dollars)." Chart. January 26, 2021. Statista. Accessed May 04, 2025. https://www.statista.com/statistics/1102613/south-korea-textiles-like-face-masks-export-value-monthly/
KITA. (2021). Monthly export value of other made-up textile products like face masks from South Korea from January 2019 to December 2020 (in million U.S. dollars). Statista. Statista Inc.. Accessed: May 04, 2025. https://www.statista.com/statistics/1102613/south-korea-textiles-like-face-masks-export-value-monthly/
KITA. "Monthly Export Value of Other Made-up Textile Products like Face Masks from South Korea from January 2019 to December 2020 (in Million U.S. Dollars)." Statista, Statista Inc., 26 Jan 2021, https://www.statista.com/statistics/1102613/south-korea-textiles-like-face-masks-export-value-monthly/
KITA, Monthly export value of other made-up textile products like face masks from South Korea from January 2019 to December 2020 (in million U.S. dollars) Statista, https://www.statista.com/statistics/1102613/south-korea-textiles-like-face-masks-export-value-monthly/ (last visited May 04, 2025)
Monthly export value of other made-up textile products like face masks from South Korea from January 2019 to December 2020 (in million U.S. dollars) [Graph], KITA, January 26, 2021. [Online]. Available: https://www.statista.com/statistics/1102613/south-korea-textiles-like-face-masks-export-value-monthly/
Profit from additional features with an Employee Account
Please create an employee account to be able to mark statistics as favorites.
Then you can access your favorite statistics via the star in the header.
Profit from the additional features of your individual account
Currently, you are using a shared account. To use individual functions (e.g., mark statistics as favourites, set
statistic alerts) please log in with your personal account.
If you are an admin, please authenticate by logging in again.