While nearly every country in Europe has a stock exchange, only five are considered major, and have a market capital of over one trillion U.S dollars. European stock exchanges make up two of the top ten global major stock markets. Europe’s biggest stock exchanges are the Euronext which combines five markets, and the London Stock Exchange. Since the Covid-19 outbreak all of Europe’s largest exchanges all saw large drops in total market capital value between January and March 2020. Since March, all major stock exchanges in Europe have been in recovery.
Coronavirus
First reported from Wuhan, China, on 31 December 2019, the Coronavirus disease (COVID-19) has massively affected stock exchanges and the financial sector globally. Approximately 210 countries and territories worldwide have been affected by the COVID-19 virus.
Euronext
As Europe’s largest stock exchange, Euronext consists of the Amsterdam, Brussels, Dublin, Lisbon and Paris stock markets. As of the end of 2022, companies trading on the Euronext stock exchange had a combined market capitalization of approximately seven trillion euros.
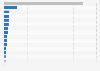
Monthly market capitalization of European stock exchanges since the Coronavirus outbreak between December 2019 and March 2024
(in billion U.S. dollars)
Characteristic
Euronext*
London Stock Exchange
Deutsche Börse
SIX Swiss Exchange
NASDAQ Nordic and Baltic Exchanges
Moscow Exchange
BME Spanish Exchanges
Mar 2024
7,223.13
-
2,299.15
1,954.66
2,037.7
-
741.64
Feb 2024
6,773.23
-
2,216.38
1,985.63
2,141.74
-
738.36
Jan 2024
6,797.47
-
2,146.01
2,025.74
2,087.15
-
746.91
Dec 2023
6,889.03
-
2,074.32
2,044.69
2,119.61
637.61
769.58
Nov 2023
6,575.06
-
2,094.97
1,917.46
1,929.99
628.88
755.19
Oct 2023
6,043.44
-
1,885
1,762.19
1,742.88
629.26
665.61
Sep 2023
6,262.68
3,423.24
1,981.96
1,848.88
1,818.41
595.21
694.43
Aug 2023
6,693.21
3,378.72
2,117.85
1,962.44
1,858.49
622.18
720.88
Jul 2023
6,947.8
3,293.65
2,230.09
2,025.37
1,936.2
588.16
741.09
Jun 2023
6,652.94
3,183.26
2,162.95
1,962.91
1,914.39
565.09
736.04
May 2023
6,420.41
3,103.89
2,130.14
1,951.02
1,867.75
579.76
668.99
Apr 2023
6,889.59
3,314.1
2,247.17
2,029.79
2,008.05
584.7
741.09
Mar 2023
6,719.73
3,162.6
2,178.04
1,938.83
1,962.31
556.9
728.5
02,0004,0006,0008,00010,000
Add this content to your personal favorites. These can be accessed from the favorites menu in the main navigation.
You have no right to use this feature.
Make sure to contact us if you are interested in scientific citation.
You can upgrade your account to enable this functionality for all statistics.
This feature is not available with your current account.Request access
Learn more about how Statista can support your business.
WFE. (May 31, 2024). Monthly market capitalization of European stock exchanges since the Coronavirus outbreak between December 2019 and March 2024 (in billion U.S. dollars) [Graph]. In Statista. Retrieved May 11, 2025, from https://www.statista.com/statistics/1102751/change-in-market-capital-of-european-stock-exchanges-since-the-coronavirus-outbreak/
WFE. "Monthly market capitalization of European stock exchanges since the Coronavirus outbreak between December 2019 and March 2024 (in billion U.S. dollars)." Chart. May 31, 2024. Statista. Accessed May 11, 2025. https://www.statista.com/statistics/1102751/change-in-market-capital-of-european-stock-exchanges-since-the-coronavirus-outbreak/
WFE. (2024). Monthly market capitalization of European stock exchanges since the Coronavirus outbreak between December 2019 and March 2024 (in billion U.S. dollars). Statista. Statista Inc.. Accessed: May 11, 2025. https://www.statista.com/statistics/1102751/change-in-market-capital-of-european-stock-exchanges-since-the-coronavirus-outbreak/
WFE. "Monthly Market Capitalization of European Stock Exchanges since The Coronavirus Outbreak between December 2019 and March 2024 (in Billion U.S. Dollars)." Statista, Statista Inc., 31 May 2024, https://www.statista.com/statistics/1102751/change-in-market-capital-of-european-stock-exchanges-since-the-coronavirus-outbreak/
WFE, Monthly market capitalization of European stock exchanges since the Coronavirus outbreak between December 2019 and March 2024 (in billion U.S. dollars) Statista, https://www.statista.com/statistics/1102751/change-in-market-capital-of-european-stock-exchanges-since-the-coronavirus-outbreak/ (last visited May 11, 2025)
Monthly market capitalization of European stock exchanges since the Coronavirus outbreak between December 2019 and March 2024 (in billion U.S. dollars) [Graph], WFE, May 31, 2024. [Online]. Available: https://www.statista.com/statistics/1102751/change-in-market-capital-of-european-stock-exchanges-since-the-coronavirus-outbreak/
Profit from additional features with an Employee Account
Please create an employee account to be able to mark statistics as favorites.
Then you can access your favorite statistics via the star in the header.
Profit from the additional features of your individual account
Currently, you are using a shared account. To use individual functions (e.g., mark statistics as favourites, set
statistic alerts) please log in with your personal account.
If you are an admin, please authenticate by logging in again.