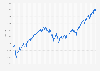
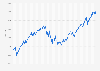
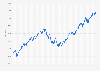
The Dow Jones Industrial Average (DJIA) index dropped around ***** points in the four weeks from February 12 to March 11, 2020, but has since recovered and peaked at ********* points as of November 24, 2024. In February 2020 - just prior to the global coronavirus (COVID-19) pandemic, the DJIA index stood at a little over ****** points.
U.S. markets suffer as virus spreads
The COVID-19 pandemic triggered a turbulent period for stock markets – the S&P 500 and Nasdaq Composite also recorded dramatic drops. At the start of February, some analysts remained optimistic that the outbreak would ease. However, the increased spread of the virus started to hit investor confidence, prompting a record plunge in the stock markets. The Dow dropped by more than ***** points in the week from February 21 to February 28, which was a fall of **** percent – its worst percentage loss in a week since October 2008.
Stock markets offer valuable economic insights
The Dow Jones Industrial Average is a stock market index that monitors the share prices of the 30 largest companies in the United States. By studying the performance of the listed companies, analysts can gauge the strength of the domestic economy. If investors are confident in a company’s future, they will buy its stocks. The uncertainty of the coronavirus sparked fears of an economic crisis, and many traders decided that investment during the pandemic was too risky.
Profit from the additional features of your individual account
Currently, you are using a shared account. To use individual functions (e.g., mark statistics as favourites, set
statistic alerts) please log in with your personal account.
If you are an admin, please authenticate by logging in again.
Learn more about how Statista can support your business.
Investing.com. (March 3, 2025). Weekly development of the Dow Jones Industrial Average Index from January 2020 to March 2025 [Graph]. In Statista. Retrieved July 20, 2025, from https://www.statista.com/statistics/1104278/weekly-performance-of-djia-index/
Investing.com. "Weekly development of the Dow Jones Industrial Average Index from January 2020 to March 2025." Chart. March 3, 2025. Statista. Accessed July 20, 2025. https://www.statista.com/statistics/1104278/weekly-performance-of-djia-index/
Investing.com. (2025). Weekly development of the Dow Jones Industrial Average Index from January 2020 to March 2025. Statista. Statista Inc.. Accessed: July 20, 2025. https://www.statista.com/statistics/1104278/weekly-performance-of-djia-index/
Investing.com. "Weekly Development of The Dow Jones Industrial Average Index from January 2020 to March 2025." Statista, Statista Inc., 3 Mar 2025, https://www.statista.com/statistics/1104278/weekly-performance-of-djia-index/
Investing.com, Weekly development of the Dow Jones Industrial Average Index from January 2020 to March 2025 Statista, https://www.statista.com/statistics/1104278/weekly-performance-of-djia-index/ (last visited July 20, 2025)
Weekly development of the Dow Jones Industrial Average Index from January 2020 to March 2025 [Graph], Investing.com, March 3, 2025. [Online]. Available: https://www.statista.com/statistics/1104278/weekly-performance-of-djia-index/