The rates of online purchase of household goods in the Netherlands have continually risen since 2016 and is one of the highest rates of online purchase of household goods in the European Union (EU). In 2019, 43 percent of individuals made purchases online in this consumer goods category.
Advertisement
Advertisement
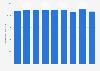
Percentage of individuals who purchased household goods online in the Netherlands from 2016 to 2019
Characteristic
Percentage of individuals
2019
43%
2018
44%
2017
40%
2016***
35%
0%10%20%30%40%50%
Add this content to your personal favorites. These can be accessed from the favorites menu in the main navigation.
You have no right to use this feature.
Make sure to contact us if you are interested in scientific citation.
You can upgrade your account to enable this functionality for all statistics.
This feature is not available with your current account.Request access
* Base= last online purchase in the 12 months. ** Sample figures refer to the 2016 survey.
Information and Communication Technologies (ICT) usage in households and by individuals are collected annually by the National Statistical Institutes and are based on Eurostat's model questionnaires. The survey is a general population/household survey.
*** The data for 2018 may be inconsistent as there was a reported break in time-series.
Learn more about how Statista can support your business.
Eurostat. (February 24, 2020). Percentage of individuals who purchased household goods online in the Netherlands from 2016 to 2019 [Graph]. In Statista. Retrieved July 08, 2025, from https://www.statista.com/statistics/1105895/internet-purchases-of-reading-materials-netherlands/
Eurostat. "Percentage of individuals who purchased household goods online in the Netherlands from 2016 to 2019." Chart. February 24, 2020. Statista. Accessed July 08, 2025. https://www.statista.com/statistics/1105895/internet-purchases-of-reading-materials-netherlands/
Eurostat. (2020). Percentage of individuals who purchased household goods online in the Netherlands from 2016 to 2019. Statista. Statista Inc.. Accessed: July 08, 2025. https://www.statista.com/statistics/1105895/internet-purchases-of-reading-materials-netherlands/
Eurostat. "Percentage of Individuals Who Purchased Household Goods Online in The Netherlands from 2016 to 2019." Statista, Statista Inc., 24 Feb 2020, https://www.statista.com/statistics/1105895/internet-purchases-of-reading-materials-netherlands/
Eurostat, Percentage of individuals who purchased household goods online in the Netherlands from 2016 to 2019 Statista, https://www.statista.com/statistics/1105895/internet-purchases-of-reading-materials-netherlands/ (last visited July 08, 2025)
Percentage of individuals who purchased household goods online in the Netherlands from 2016 to 2019 [Graph], Eurostat, February 24, 2020. [Online]. Available: https://www.statista.com/statistics/1105895/internet-purchases-of-reading-materials-netherlands/
Advertisement
Profit from additional features with an Employee Account
Please create an employee account to be able to mark statistics as favorites.
Then you can access your favorite statistics via the star in the header.
Profit from the additional features of your individual account
Currently, you are using a shared account. To use individual functions (e.g., mark statistics as favourites, set
statistic alerts) please log in with your personal account.
If you are an admin, please authenticate by logging in again.