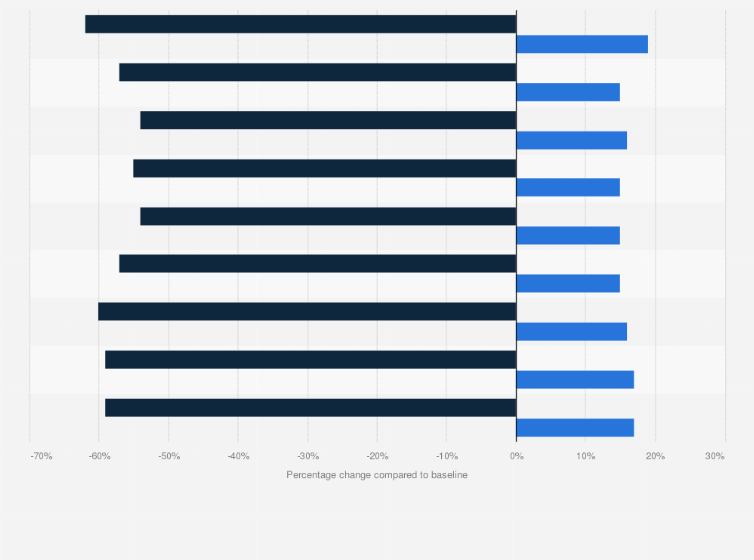
The coronavirus lockdown has resulted in a significant increase in residential location footfall in the United Kingdom, compared with a huge decline in workplace locations. London saw the highest increase in residential location tracking at 19 percent, as well as the largest decline in workplace activity at -62 percent. In all the major UK cities provided here, there has been a decline in workplace activity and an increase in residential activity, implying that the British public are adhering to the government's social distancing pleas.
Adjust the presentation of the statistic and data points.
Share the statistic on social media channels or embed the statistic in your
website using "Embed Code", where available.
Cite this statistic and select one of the following formats: APA, Chicago, Harvard, MLA & Bluebook.
Print the statistic including description and metadata.
Chart type
Percentage change in mobility after the coronavirus lockdown in selected urban areas in the United Kingdom in March 2020*
Share this statistic
You have no right to use this feature.
Make sure to contact us if you are interested in scientific citation.
You can upgrade your account to enable this functionality for all statistics.
This feature is not available with your current account.Request access
* Change compared to baseline. The source adds the following information: "The baseline is the median value, for the corresponding day of the week, during the 5-week period Jan 3–Feb 6, 2020. The reports show trends over several weeks with the most recent data representing approximately 2-3 days ago— this is how long it takes to produce the reports."
Learn more about how Statista can support your business.
Google. (March 29, 2020). Percentage change in mobility after the coronavirus lockdown in selected urban areas in the United Kingdom in March 2020* [Graph]. In Statista. Retrieved June 05, 2025, from https://www.statista.com/statistics/1109764/mobility-changes-in-the-uk-cites/
Google. "Percentage change in mobility after the coronavirus lockdown in selected urban areas in the United Kingdom in March 2020*." Chart. March 29, 2020. Statista. Accessed June 05, 2025. https://www.statista.com/statistics/1109764/mobility-changes-in-the-uk-cites/
Google. (2020). Percentage change in mobility after the coronavirus lockdown in selected urban areas in the United Kingdom in March 2020*. Statista. Statista Inc.. Accessed: June 05, 2025. https://www.statista.com/statistics/1109764/mobility-changes-in-the-uk-cites/
Google. "Percentage Change in Mobility after The Coronavirus Lockdown in Selected Urban Areas in The United Kingdom in March 2020*." Statista, Statista Inc., 29 Mar 2020, https://www.statista.com/statistics/1109764/mobility-changes-in-the-uk-cites/
Google, Percentage change in mobility after the coronavirus lockdown in selected urban areas in the United Kingdom in March 2020* Statista, https://www.statista.com/statistics/1109764/mobility-changes-in-the-uk-cites/ (last visited June 05, 2025)
Percentage change in mobility after the coronavirus lockdown in selected urban areas in the United Kingdom in March 2020* [Graph], Google, March 29, 2020. [Online]. Available: https://www.statista.com/statistics/1109764/mobility-changes-in-the-uk-cites/
Profit from additional features with an Employee Account
Please create an employee account to be able to mark statistics as favorites.
Then you can access your favorite statistics via the star in the header.
Profit from the additional features of your individual account
Currently, you are using a shared account. To use individual functions (e.g., mark statistics as favourites, set
statistic alerts) please log in with your personal account.
If you are an admin, please authenticate by logging in again.