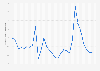
The FAO Meat Price Index* started to increase in October of 2020. For the first few months of the pandemic, prices had declined. In 2021, prices further increased and the index reached an all time high of 125.4 index points in June of 2022, a few months after the start of the Russian invasion of Ukraine. Since then, the index has fluctuated and came to 117.7 in January 2025.
For further information about the coronavirus (COVID-19) pandemic, please visit our dedicated facts and figures page.
For further information about the Russian invasion of Ukraine, please visit our dedicated page on the topic.
Advertisement
Advertisement
Monthly meat price index worldwide from January 2000 to January 2025
Characteristic
Food price index (2014-2016=100)
2025-01
117.7
2024-12
119.4
2024-11
118.7
2024-10
119.2
2024-09
119.9
2024-08
122
2024-07
120
2024-06
118.1
2024-05
116.7
2024-04
116.6
2024-03
114.9
2024-02
112.5
2024-01
108.9
2023-12
111.2
2023-11
111.6
2023-10
112
2023-09
113.4
2023-08
114.5
2023-07
117.9
2023-06
118.6
2023-05
117.4
2023-04
116
2023-03
114.1
2023-02
112.1
2023-01
110.5
2022-12
111.9
2022-11
114.1
2022-10
116.5
2022-09
119.9
2022-08
120.3
2022-07
123.3
2022-06
125.4
2022-05
122.5
2022-04
121.3
2022-03
119.3
2022-02
113.7
2022-01
111.7
2021-12
110.5
2021-11
112.4
2021-10
111.6
2021-09
112.1
2021-08
113.1
2021-07
113.3
2021-06
110.9
2021-05
108.1
2021-04
104.4
2021-03
100.5
2021-02
97.7
2021-01
95.9
2020-12
94.7
2020-11
93.1
2020-10
91.6
2020-09
91.2
2020-08
91.4
2020-07
91.4
2020-06
94.5
2020-05
95.4
2020-04
96.5
2020-03
99.5
2020-02
101
2020-01
103.5
2019-12
106
2019-11
105.4
2019-10
100.9
2019-09
100.6
2019-08
101.6
2019-07
102.3
2019-06
101.2
2019-05
100.2
2019-04
97.3
2019-03
94
2019-02
92.5
2019-01
91.6
2018-12
92.3
2018-11
92.1
2018-10
91.9
2018-09
93.4
2018-08
95.4
2018-07
94.3
2018-06
94.7
2018-05
94.9
2018-04
95.4
2018-03
96.6
2018-02
96.6
2018-01
95.3
2017-12
96
2017-11
98
2017-10
98.2
2017-09
98.6
2017-08
100
2017-07
100.6
2017-06
100.1
2017-05
99.3
2017-04
97.3
2017-03
95.4
2017-02
94
2017-01
92.2
2016-12
91.2
2016-11
93.9
2016-10
93
2016-09
94.9
2016-08
96.4
2016-07
95.3
2016-06
94.1
2016-05
90.2
2016-04
87.7
2016-03
86.1
2016-02
86
2016-01
84.4
2015-12
86.8
2015-11
89.2
2015-10
92.1
2015-09
96.7
2015-08
99
2015-07
99
2015-06
98.7
2015-05
99.6
2015-04
97.4
2015-03
97.1
2015-02
101.3
2015-01
104.6
2014-12
108.9
2014-11
114.8
2014-10
117.1
2014-09
117.5
2014-08
118.5
2014-07
117.4
2014-06
116
2014-05
111.7
2014-04
109.7
2014-03
106.3
2014-02
104.1
2014-01
103.2
2013-12
104.7
2013-11
105.4
2013-10
106.3
2013-09
106
2013-08
105.5
2013-07
104.7
2013-06
105
2013-05
105.7
2013-04
108.8
2013-03
108.2
2013-02
107.8
2013-01
106.6
2012-12
107.2
2012-11
107.4
2012-10
107.9
2012-09
106.7
2012-08
102.5
2012-07
99.8
2012-06
101.1
2012-05
103.7
2012-04
105.8
2012-03
106.2
2012-02
105.5
2012-01
102.6
2011-12
106.1
2011-11
107.8
2011-10
105.9
2011-09
106.1
2011-08
104.9
2011-07
105.8
2011-06
106.2
2011-05
108
2011-04
107.5
2011-03
103.6
2011-02
100.5
2011-01
97.9
2010-12
97.5
2010-11
96.4
2010-10
93.9
2010-09
92.5
2010-08
92.9
2010-07
92
2010-06
91.2
2010-05
90.1
2010-04
90.1
2010-03
87.5
2010-02
86.5
2010-01
86
2009-12
84.5
2009-11
83.9
2009-10
82.6
2009-09
84.5
2009-08
85.4
2009-07
85.2
2009-06
83.4
2009-05
81.3
2009-04
78.5
2009-03
76.1
2009-02
76
2009-01
78.1
2008-12
81.8
2008-11
87.9
2008-10
95.7
2008-09
100.9
2008-08
102.1
2008-07
100.4
2008-06
93.6
2008-05
91.8
2008-04
87
2008-03
85.6
2008-02
80.6
2008-01
82.8
2007-12
81.8
2007-11
81.1
2007-10
80.1
2007-09
81.4
2007-08
79.9
2007-07
79.9
2007-06
78.8
2007-05
77.5
2007-04
75.8
2007-03
73.9
2007-02
72.2
2007-01
70.7
2006-12
71.3
2006-11
72.6
2006-10
74.3
2006-09
75.3
2006-08
74.8
2006-07
72.7
2006-06
71.3
2006-05
69
2006-04
67.4
2006-03
68
2006-02
68.8
2006-01
71.2
2005-12
74.4
2005-11
74.1
2005-10
73.8
2005-09
73.9
2005-08
72.8
2005-07
72.6
2005-06
73.6
2005-05
72.6
2005-04
70.4
2005-03
71.7
2005-02
71.1
2005-01
69.9
2004-12
69.9
2004-11
69.2
2004-10
68.2
2004-09
70.2
2004-08
69.8
2004-07
71.6
2004-06
69.9
2004-05
67
2004-04
67.5
2004-03
67.6
2004-02
65.1
2004-01
67.2
2003-12
62.5
2003-11
62.9
2003-10
63.6
2003-09
63.7
2003-08
61.4
2003-07
61.5
2003-06
57.3
2003-05
57.4
2003-04
56.7
2003-03
55.7
2003-02
55.1
2003-01
53.9
2002-12
52.3
2002-11
53.9
2002-10
53.5
2002-09
55.1
2002-08
55.8
2002-07
55.9
2002-06
56.3
2002-05
56.2
2002-04
57.2
2002-03
60.1
2002-02
57.6
2002-01
59.4
2001-12
59.2
2001-11
60.6
2001-10
62.4
2001-09
64.3
2001-08
64.4
2001-07
64.1
2001-06
63.8
2001-05
65.6
2001-04
65.3
2001-03
64.9
2001-02
62
2001-01
58.3
2000-12
60.4
2000-11
60.4
2000-10
59.5
2000-09
59.4
2000-08
60.3
2000-07
62.7
2000-06
63
2000-05
63.3
2000-04
62.3
2000-03
62.8
2000-02
60.9
2000-01
60.6
Zoomable Statistic: Select the range in the chart you want to zoom in on.
* The source notes: "Meat Price Index: Based on 35 average export unit values/market prices of four meat types (bovine, pig, poultry, and ovine) from 10 representative markets. Within each meat type, export unit values/prices are weighted by the trade shares of their respective markets, while the meat types are weighted by their average global export trade shares for 2014-2016. Quotations for the two most recent months may consist of estimates and be subject to revision."
Profit from the additional features of your individual account
Currently, you are using a shared account. To use individual functions (e.g., mark statistics as favourites, set
statistic alerts) please log in with your personal account.
If you are an admin, please authenticate by logging in again.
Learn more about how Statista can support your business.
FAO. (February 13, 2025). Monthly meat price index worldwide from January 2000 to January 2025 [Graph]. In Statista. Retrieved June 20, 2025, from https://www.statista.com/statistics/1111307/impact-of-coronavirus-on-monthly-meat-price-index-worldwide/
FAO. "Monthly meat price index worldwide from January 2000 to January 2025." Chart. February 13, 2025. Statista. Accessed June 20, 2025. https://www.statista.com/statistics/1111307/impact-of-coronavirus-on-monthly-meat-price-index-worldwide/
FAO. (2025). Monthly meat price index worldwide from January 2000 to January 2025. Statista. Statista Inc.. Accessed: June 20, 2025. https://www.statista.com/statistics/1111307/impact-of-coronavirus-on-monthly-meat-price-index-worldwide/
FAO. "Monthly Meat Price Index Worldwide from January 2000 to January 2025." Statista, Statista Inc., 13 Feb 2025, https://www.statista.com/statistics/1111307/impact-of-coronavirus-on-monthly-meat-price-index-worldwide/
FAO, Monthly meat price index worldwide from January 2000 to January 2025 Statista, https://www.statista.com/statistics/1111307/impact-of-coronavirus-on-monthly-meat-price-index-worldwide/ (last visited June 20, 2025)
Monthly meat price index worldwide from January 2000 to January 2025 [Graph], FAO, February 13, 2025. [Online]. Available: https://www.statista.com/statistics/1111307/impact-of-coronavirus-on-monthly-meat-price-index-worldwide/