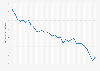
Per capita transportation emissions in India increased by 25 percent between 2015 and 2020. This was the greatest change in per capita transportation emissions among G20 countries, with other noticeable increases observed in China and Indonesia.
Advertisement
Advertisement
Transportation emission reductions per capita worldwide from 2015 to 2020, by select country
Profit from the additional features of your individual account
Currently, you are using a shared account. To use individual functions (e.g., mark statistics as favourites, set
statistic alerts) please log in with your personal account.
If you are an admin, please authenticate by logging in again.
Learn more about how Statista can support your business.
Climate Transparency. (October 14, 2021). Transportation emission reductions per capita worldwide from 2015 to 2020, by select country [Graph]. In Statista. Retrieved June 27, 2025, from https://www.statista.com/statistics/1116633/change-emissions-per-capita-transport-sector-globally-by-country/
Climate Transparency. "Transportation emission reductions per capita worldwide from 2015 to 2020, by select country." Chart. October 14, 2021. Statista. Accessed June 27, 2025. https://www.statista.com/statistics/1116633/change-emissions-per-capita-transport-sector-globally-by-country/
Climate Transparency. (2021). Transportation emission reductions per capita worldwide from 2015 to 2020, by select country. Statista. Statista Inc.. Accessed: June 27, 2025. https://www.statista.com/statistics/1116633/change-emissions-per-capita-transport-sector-globally-by-country/
Climate Transparency. "Transportation Emission Reductions per Capita Worldwide from 2015 to 2020, by Select Country." Statista, Statista Inc., 14 Oct 2021, https://www.statista.com/statistics/1116633/change-emissions-per-capita-transport-sector-globally-by-country/
Climate Transparency, Transportation emission reductions per capita worldwide from 2015 to 2020, by select country Statista, https://www.statista.com/statistics/1116633/change-emissions-per-capita-transport-sector-globally-by-country/ (last visited June 27, 2025)
Transportation emission reductions per capita worldwide from 2015 to 2020, by select country [Graph], Climate Transparency, October 14, 2021. [Online]. Available: https://www.statista.com/statistics/1116633/change-emissions-per-capita-transport-sector-globally-by-country/