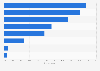
As a response to the COVID-19 outbreak, the average spend per order on grocery delivery and pickup in the United States grew by 14 percent to 82 U.S. dollars in March 2020, compared to 72 dollars in August 2019. The average spend grew an additional 16 percent from March to August, before dropping to 77 dollars per order in May 2021.
For further information about the coronavirus (COVID-19) pandemic, please visit our dedicated Facts and Figures page.
Advertisement
Advertisement
Average spend for grocery delivery and pickup in the United States in August 2019 and March to May 2021
(in U.S. dollars)
Characteristic
Average spend in U.S. dollars
May 2021
77
Aug 2020
95
Jun 2020
84
May 2020
90
Apr 2020
85
Mar 2020
82
Aug 2019
72
020406080100120
Add this content to your personal favorites. These can be accessed from the favorites menu in the main navigation.
You have no right to use this feature.
Make sure to contact us if you are interested in scientific citation.
You can upgrade your account to enable this functionality for all statistics.
This feature is not available with your current account.Request access
Learn more about how Statista can support your business.
Brick Meets Click. (June 21, 2021). Average spend for grocery delivery and pickup in the United States in August 2019 and March to May 2021 (in U.S. dollars) [Graph]. In Statista. Retrieved July 14, 2025, from https://www.statista.com/statistics/1120254/coronavirus-grocery-delivery-pickup-spend-us/
Brick Meets Click. "Average spend for grocery delivery and pickup in the United States in August 2019 and March to May 2021 (in U.S. dollars)." Chart. June 21, 2021. Statista. Accessed July 14, 2025. https://www.statista.com/statistics/1120254/coronavirus-grocery-delivery-pickup-spend-us/
Brick Meets Click. (2021). Average spend for grocery delivery and pickup in the United States in August 2019 and March to May 2021 (in U.S. dollars). Statista. Statista Inc.. Accessed: July 14, 2025. https://www.statista.com/statistics/1120254/coronavirus-grocery-delivery-pickup-spend-us/
Brick Meets Click. "Average Spend for Grocery Delivery and Pickup in The United States in August 2019 and March to May 2021 (in U.S. Dollars)." Statista, Statista Inc., 21 Jun 2021, https://www.statista.com/statistics/1120254/coronavirus-grocery-delivery-pickup-spend-us/
Brick Meets Click, Average spend for grocery delivery and pickup in the United States in August 2019 and March to May 2021 (in U.S. dollars) Statista, https://www.statista.com/statistics/1120254/coronavirus-grocery-delivery-pickup-spend-us/ (last visited July 14, 2025)
Average spend for grocery delivery and pickup in the United States in August 2019 and March to May 2021 (in U.S. dollars) [Graph], Brick Meets Click, June 21, 2021. [Online]. Available: https://www.statista.com/statistics/1120254/coronavirus-grocery-delivery-pickup-spend-us/
Advertisement
Profit from additional features with an Employee Account
Please create an employee account to be able to mark statistics as favorites.
Then you can access your favorite statistics via the star in the header.
Profit from the additional features of your individual account
Currently, you are using a shared account. To use individual functions (e.g., mark statistics as favourites, set
statistic alerts) please log in with your personal account.
If you are an admin, please authenticate by logging in again.