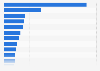
Face skin care products were the most sold category in the pharmaceutical cosmetics market in Russia in 2024. Universal products followed, with a sales share of nearly **** percent in the given timeframe. Body care products ranked third.
Profit from the additional features of your individual account
Currently, you are using a shared account. To use individual functions (e.g., mark statistics as favourites, set
statistic alerts) please log in with your personal account.
If you are an admin, please authenticate by logging in again.
Learn more about how Statista can support your business.
DSM Group. (May 5, 2025). Breakdown of pharmaceutical cosmetic sales in Russia in 2024, by purpose of use [Graph]. In Statista. Retrieved June 12, 2025, from https://www.statista.com/statistics/1121384/russia-pharmaceutical-cosmetics-sales-share-by-type/
DSM Group. "Breakdown of pharmaceutical cosmetic sales in Russia in 2024, by purpose of use." Chart. May 5, 2025. Statista. Accessed June 12, 2025. https://www.statista.com/statistics/1121384/russia-pharmaceutical-cosmetics-sales-share-by-type/
DSM Group. (2025). Breakdown of pharmaceutical cosmetic sales in Russia in 2024, by purpose of use. Statista. Statista Inc.. Accessed: June 12, 2025. https://www.statista.com/statistics/1121384/russia-pharmaceutical-cosmetics-sales-share-by-type/
DSM Group. "Breakdown of Pharmaceutical Cosmetic Sales in Russia in 2024, by Purpose of Use." Statista, Statista Inc., 5 May 2025, https://www.statista.com/statistics/1121384/russia-pharmaceutical-cosmetics-sales-share-by-type/
DSM Group, Breakdown of pharmaceutical cosmetic sales in Russia in 2024, by purpose of use Statista, https://www.statista.com/statistics/1121384/russia-pharmaceutical-cosmetics-sales-share-by-type/ (last visited June 12, 2025)
Breakdown of pharmaceutical cosmetic sales in Russia in 2024, by purpose of use [Graph], DSM Group, May 5, 2025. [Online]. Available: https://www.statista.com/statistics/1121384/russia-pharmaceutical-cosmetics-sales-share-by-type/