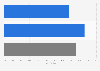
As of 2018, 20 percent of surveyed women had undergone female genital mutilation. Compared to 2013, this figure decreased by five percentage points.
Female genital mutilation is defined by the World Health Organization as any procedure that involves partial or total removal of the external genitalia and/or injury to the female genital organs for non-therapeutic reasons.
Advertisement
Advertisement
Prevalence of female genital mutilation in Nigeria in 2013 and 2018, by area
The source adds the following information: "Female genital mutilation (FGM), also known as female genital cutting or female circumcision, is defined by the World Health Organization (WHO) as any procedure that involves partial or total removal of the external genitalia and/or injury to the female genital organs whether for cultural or any other non-therapeutic reason."
Profit from the additional features of your individual account
Currently, you are using a shared account. To use individual functions (e.g., mark statistics as favourites, set
statistic alerts) please log in with your personal account.
If you are an admin, please authenticate by logging in again.
Learn more about how Statista can support your business.
The DHS Program. (October 31, 2019). Prevalence of female genital mutilation in Nigeria in 2013 and 2018, by area [Graph]. In Statista. Retrieved June 27, 2025, from https://www.statista.com/statistics/1124994/prevalence-of-female-genital-mutilation-in-nigeria/
The DHS Program. "Prevalence of female genital mutilation in Nigeria in 2013 and 2018, by area." Chart. October 31, 2019. Statista. Accessed June 27, 2025. https://www.statista.com/statistics/1124994/prevalence-of-female-genital-mutilation-in-nigeria/
The DHS Program. (2019). Prevalence of female genital mutilation in Nigeria in 2013 and 2018, by area. Statista. Statista Inc.. Accessed: June 27, 2025. https://www.statista.com/statistics/1124994/prevalence-of-female-genital-mutilation-in-nigeria/
The DHS Program. "Prevalence of Female Genital Mutilation in Nigeria in 2013 and 2018, by Area." Statista, Statista Inc., 31 Oct 2019, https://www.statista.com/statistics/1124994/prevalence-of-female-genital-mutilation-in-nigeria/
The DHS Program, Prevalence of female genital mutilation in Nigeria in 2013 and 2018, by area Statista, https://www.statista.com/statistics/1124994/prevalence-of-female-genital-mutilation-in-nigeria/ (last visited June 27, 2025)
Prevalence of female genital mutilation in Nigeria in 2013 and 2018, by area [Graph], The DHS Program, October 31, 2019. [Online]. Available: https://www.statista.com/statistics/1124994/prevalence-of-female-genital-mutilation-in-nigeria/