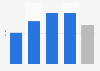
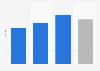
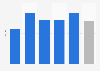
In the fourth quarter of 2023, the number of women in South Africa of working age almost reached almost 20.7 million, while the number of men of working age reached roughly 20.4 million. This is marking a year-on-year change of 1.3 percent and 1.4 percent compared to the fourth quarter of 2022, respectively.
Advertisement
Advertisement
Population of working age in South Africa from Q1 2020 to Q4 2023, by gender
(in 1,000s)
Characteristic
Women
Men
Q4 2023
20,664
20,357
Q3 2023
20,599
20,287
Q2 2023
20,532
20,214
Q1 2023
20,463
20,140
Q4 2022
20,395
20,067
Q3 2022
20,327
19,995
Q2 2022
20,257
19,920
Q1 2022
20,187
19,846
Q4 2021
20,117
19,771
Q3 2021
20,047
19,698
Q2 2021
19,977
19,623
Q1 2021
19,907
19,548
Q4 2020
19,837
19,474
05,00010,00015,00020,00025,000
Add this content to your personal favorites. These can be accessed from the favorites menu in the main navigation.
You have no right to use this feature.
Make sure to contact us if you are interested in scientific citation.
You can upgrade your account to enable this functionality for all statistics.
This feature is not available with your current account.Request access
Learn more about how Statista can support your business.
Statistics South Africa. (February 20, 2024). Population of working age in South Africa from Q1 2020 to Q4 2023, by gender (in 1,000s) [Graph]. In Statista. Retrieved July 05, 2025, from https://www.statista.com/statistics/1129143/population-of-working-age-by-gender-in-south-africa/
Statistics South Africa. "Population of working age in South Africa from Q1 2020 to Q4 2023, by gender (in 1,000s)." Chart. February 20, 2024. Statista. Accessed July 05, 2025. https://www.statista.com/statistics/1129143/population-of-working-age-by-gender-in-south-africa/
Statistics South Africa. (2024). Population of working age in South Africa from Q1 2020 to Q4 2023, by gender (in 1,000s). Statista. Statista Inc.. Accessed: July 05, 2025. https://www.statista.com/statistics/1129143/population-of-working-age-by-gender-in-south-africa/
Statistics South Africa. "Population of Working Age in South Africa from Q1 2020 to Q4 2023, by Gender (in 1,000s)." Statista, Statista Inc., 20 Feb 2024, https://www.statista.com/statistics/1129143/population-of-working-age-by-gender-in-south-africa/
Statistics South Africa, Population of working age in South Africa from Q1 2020 to Q4 2023, by gender (in 1,000s) Statista, https://www.statista.com/statistics/1129143/population-of-working-age-by-gender-in-south-africa/ (last visited July 05, 2025)
Population of working age in South Africa from Q1 2020 to Q4 2023, by gender (in 1,000s) [Graph], Statistics South Africa, February 20, 2024. [Online]. Available: https://www.statista.com/statistics/1129143/population-of-working-age-by-gender-in-south-africa/
Advertisement
Profit from additional features with an Employee Account
Please create an employee account to be able to mark statistics as favorites.
Then you can access your favorite statistics via the star in the header.
Profit from the additional features of your individual account
Currently, you are using a shared account. To use individual functions (e.g., mark statistics as favourites, set
statistic alerts) please log in with your personal account.
If you are an admin, please authenticate by logging in again.