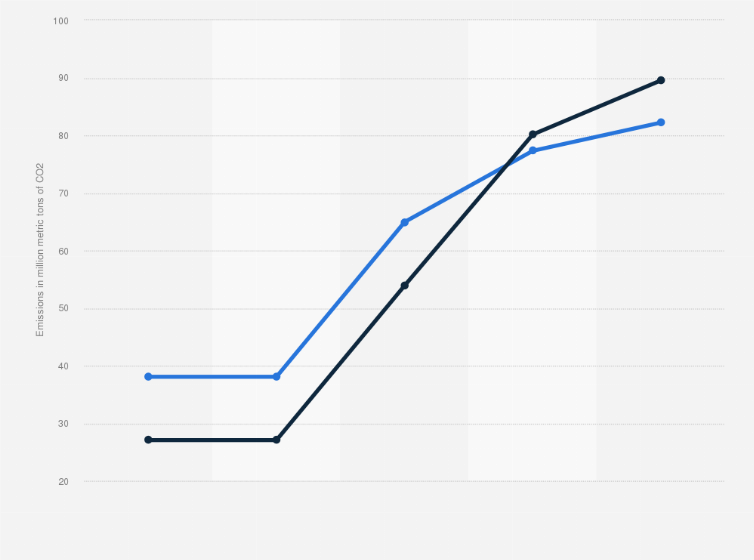
In the first three months of 2020, emission levels from the cement industry in China were noticeably lower than during the same period in 2019. In March, emissions amounted to 54 million metric tons of CO2, compared with 65 million metric tons of CO2 in the same month the previous year. In the first few months of 2020, China, like many nations, was under strict lockdown due to the outbreak of COVID-19, which in turn affected many industries. Although levels began lower than the previous year, they started to increase as lockdown measures loosened. There was a dramatic surge in May, with levels of CO2 surpassing those recorded in May 2019.
Advertisement
Advertisement
Monthly emissions produced by the cement industry in China from January to May 2020, compared with 2019
(in million metric tons of CO2)
Adjust the presentation of the statistic and data points.
Share the statistic on social media channels or embed the statistic in your
website using "Embed Code", where available.
Cite this statistic and select one of the following formats: APA, Chicago, Harvard, MLA & Bluebook.
Print the statistic including description and metadata.
Chart type
Monthly emissions produced by the cement industry in China from January to May 2020, compared with 2019
Share this statistic
You have no right to use this feature.
Make sure to contact us if you are interested in scientific citation.
You can upgrade your account to enable this functionality for all statistics.
This feature is not available with your current account.Request access
Learn more about how Statista can support your business.
Carbon Brief. (June 29, 2020). Monthly emissions produced by the cement industry in China from January to May 2020, compared with 2019 (in million metric tons of CO2) [Graph]. In Statista. Retrieved June 17, 2025, from https://www.statista.com/statistics/1129563/monthly-cement-emissions-in-first-half-of-2020-in-china/
Carbon Brief. "Monthly emissions produced by the cement industry in China from January to May 2020, compared with 2019 (in million metric tons of CO2)." Chart. June 29, 2020. Statista. Accessed June 17, 2025. https://www.statista.com/statistics/1129563/monthly-cement-emissions-in-first-half-of-2020-in-china/
Carbon Brief. (2020). Monthly emissions produced by the cement industry in China from January to May 2020, compared with 2019 (in million metric tons of CO2). Statista. Statista Inc.. Accessed: June 17, 2025. https://www.statista.com/statistics/1129563/monthly-cement-emissions-in-first-half-of-2020-in-china/
Carbon Brief. "Monthly Emissions Produced by The Cement Industry in China from January to May 2020, Compared with 2019 (in Million Metric Tons of Co2)." Statista, Statista Inc., 29 Jun 2020, https://www.statista.com/statistics/1129563/monthly-cement-emissions-in-first-half-of-2020-in-china/
Carbon Brief, Monthly emissions produced by the cement industry in China from January to May 2020, compared with 2019 (in million metric tons of CO2) Statista, https://www.statista.com/statistics/1129563/monthly-cement-emissions-in-first-half-of-2020-in-china/ (last visited June 17, 2025)
Monthly emissions produced by the cement industry in China from January to May 2020, compared with 2019 (in million metric tons of CO2) [Graph], Carbon Brief, June 29, 2020. [Online]. Available: https://www.statista.com/statistics/1129563/monthly-cement-emissions-in-first-half-of-2020-in-china/
Advertisement
Profit from additional features with an Employee Account
Please create an employee account to be able to mark statistics as favorites.
Then you can access your favorite statistics via the star in the header.
Profit from the additional features of your individual account
Currently, you are using a shared account. To use individual functions (e.g., mark statistics as favourites, set
statistic alerts) please log in with your personal account.
If you are an admin, please authenticate by logging in again.