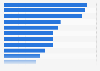
In 2018, the total liabilities of Absa Group Limited reached 88.16 billion U.S. dollars, up from 73.6 billion U.S. dollars in the previous year. Absa Group Limited is based in South Africa, and is one of the biggest financial institutions on the continent.
Profit from the additional features of your individual account
Currently, you are using a shared account. To use individual functions (e.g., mark statistics as favourites, set
statistic alerts) please log in with your personal account.
If you are an admin, please authenticate by logging in again.
Learn more about how Statista can support your business.
Statista. (January 28, 2020). Total liabilities of Absa Group Limited from 2016 to 2018 (in billion U.S. dollars) [Graph]. In Statista. Retrieved May 17, 2025, from https://www.statista.com/statistics/1136311/total-liabilities-absa-group-limited/
Statista. "Total liabilities of Absa Group Limited from 2016 to 2018 (in billion U.S. dollars)." Chart. January 28, 2020. Statista. Accessed May 17, 2025. https://www.statista.com/statistics/1136311/total-liabilities-absa-group-limited/
Statista. (2020). Total liabilities of Absa Group Limited from 2016 to 2018 (in billion U.S. dollars). Statista. Statista Inc.. Accessed: May 17, 2025. https://www.statista.com/statistics/1136311/total-liabilities-absa-group-limited/
Statista. "Total Liabilities of Absa Group Limited from 2016 to 2018 (in Billion U.S. Dollars)." Statista, Statista Inc., 28 Jan 2020, https://www.statista.com/statistics/1136311/total-liabilities-absa-group-limited/
Statista, Total liabilities of Absa Group Limited from 2016 to 2018 (in billion U.S. dollars) Statista, https://www.statista.com/statistics/1136311/total-liabilities-absa-group-limited/ (last visited May 17, 2025)
Total liabilities of Absa Group Limited from 2016 to 2018 (in billion U.S. dollars) [Graph], Statista, January 28, 2020. [Online]. Available: https://www.statista.com/statistics/1136311/total-liabilities-absa-group-limited/