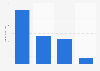
As of April 2020, the cost of production relative to raw materials was close to 70 units. However, the cost of electricity and labor were ranked among the lower costs with 7.5 units for each. Other costs accounted for 16 units. These included financing, logistics, production and set-up costs.
Advertisement
Advertisement
Distribution of active pharmaceutical ingredient (API) production cost in India as of April 2020, by category
(in units)
Adjust the presentation of the statistic and data points.
Share the statistic on social media channels or embed the statistic in your
website using "Embed Code", where available.
Cite this statistic and select one of the following formats: APA, Chicago, Harvard, MLA & Bluebook.
Print the statistic including description and metadata.
Chart type
Distribution of active pharmaceutical ingredient (API) production cost in India as of April 2020, by category
Share this statistic
You have no right to use this feature.
Make sure to contact us if you are interested in scientific citation.
You can upgrade your account to enable this functionality for all statistics.
This feature is not available with your current account.Request access
Learn more about how Statista can support your business.
Confederation of Indian Industry. (April 11, 2020). Distribution of active pharmaceutical ingredient (API) production cost in India as of April 2020, by category (in units) [Graph]. In Statista. Retrieved June 15, 2025, from https://www.statista.com/statistics/1137320/india-distribution-of-api-production-cost-by-category/
Confederation of Indian Industry. "Distribution of active pharmaceutical ingredient (API) production cost in India as of April 2020, by category (in units)." Chart. April 11, 2020. Statista. Accessed June 15, 2025. https://www.statista.com/statistics/1137320/india-distribution-of-api-production-cost-by-category/
Confederation of Indian Industry. (2020). Distribution of active pharmaceutical ingredient (API) production cost in India as of April 2020, by category (in units). Statista. Statista Inc.. Accessed: June 15, 2025. https://www.statista.com/statistics/1137320/india-distribution-of-api-production-cost-by-category/
Confederation of Indian Industry. "Distribution of Active Pharmaceutical Ingredient (Api) Production Cost in India as of April 2020, by Category (in Units)." Statista, Statista Inc., 11 Apr 2020, https://www.statista.com/statistics/1137320/india-distribution-of-api-production-cost-by-category/
Confederation of Indian Industry, Distribution of active pharmaceutical ingredient (API) production cost in India as of April 2020, by category (in units) Statista, https://www.statista.com/statistics/1137320/india-distribution-of-api-production-cost-by-category/ (last visited June 15, 2025)
Distribution of active pharmaceutical ingredient (API) production cost in India as of April 2020, by category (in units) [Graph], Confederation of Indian Industry, April 11, 2020. [Online]. Available: https://www.statista.com/statistics/1137320/india-distribution-of-api-production-cost-by-category/
Advertisement
Profit from additional features with an Employee Account
Please create an employee account to be able to mark statistics as favorites.
Then you can access your favorite statistics via the star in the header.
Profit from the additional features of your individual account
Currently, you are using a shared account. To use individual functions (e.g., mark statistics as favourites, set
statistic alerts) please log in with your personal account.
If you are an admin, please authenticate by logging in again.