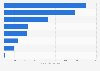
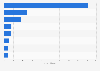
India processed over ** percent of total waste generated in financial year 2024. This is a considerable increase when compared to financial year 2016, in which less than ** percent of waste generated was processed.
Profit from the additional features of your individual account
Currently, you are using a shared account. To use individual functions (e.g., mark statistics as favourites, set
statistic alerts) please log in with your personal account.
If you are an admin, please authenticate by logging in again.
Learn more about how Statista can support your business.
MOSPI. (June 25, 2024). Share of waste processed in India from FY 2016 to FY 2024 [Graph]. In Statista. Retrieved June 28, 2025, from https://www.statista.com/statistics/1147662/india-share-of-waste-processed/
MOSPI. "Share of waste processed in India from FY 2016 to FY 2024." Chart. June 25, 2024. Statista. Accessed June 28, 2025. https://www.statista.com/statistics/1147662/india-share-of-waste-processed/
MOSPI. (2024). Share of waste processed in India from FY 2016 to FY 2024. Statista. Statista Inc.. Accessed: June 28, 2025. https://www.statista.com/statistics/1147662/india-share-of-waste-processed/
MOSPI. "Share of Waste Processed in India from Fy 2016 to Fy 2024." Statista, Statista Inc., 25 Jun 2024, https://www.statista.com/statistics/1147662/india-share-of-waste-processed/
MOSPI, Share of waste processed in India from FY 2016 to FY 2024 Statista, https://www.statista.com/statistics/1147662/india-share-of-waste-processed/ (last visited June 28, 2025)
Share of waste processed in India from FY 2016 to FY 2024 [Graph], MOSPI, June 25, 2024. [Online]. Available: https://www.statista.com/statistics/1147662/india-share-of-waste-processed/