In the 2023 financial year, it was estimated that Australians had on average 226.5 grams of carbohydrate available to consume per day, which was the highest quantity compared to other macronutrient types. Australian and New Zealand dietary guidelines suggest that adults should gain 45 to 65 percent of their total energy intake from carbohydrates, which is about 230 to 310 grams per day.
Advertisement
Advertisement
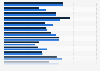
Estimated average daily macronutrient intake per capita in Australia in financial year 2023, by type
(in grams)
Characteristic
Macronutrient quantity in grams
Protein
79
Total Fat
91.9
Saturated fat
35.8
Monounsaturated fat
35.4
Polyunsaturated fat
13.6
Linoleic acid
11.4
Alpha-Linolenic acid
1.7
Total long chain omega 3 fatty acids
0.2
Trans fatty acids
1.6
Carbohydrate
226.5
Total sugars
109.3
Free sugar
66.9
Added sugar
61.6
020406080100120140160180200220240260
Add this content to your personal favorites. These can be accessed from the favorites menu in the main navigation.
You have no right to use this feature.
Make sure to contact us if you are interested in scientific citation.
You can upgrade your account to enable this functionality for all statistics.
This feature is not available with your current account.Request access
values displayed in milligrams by the source have been converted from milligrams to grams
Supplementary notes
Values have been rounded.
Australia's financial year runs from July 1 to June 30; for example, financial year 2017 starts on July 1, 2016 and ends on June 30, 2017.
Data represents the apparent consumption of food based on the amount of food purchased from sales data. Actual consumption is not measured as the data does not account for food purchases from fast food outlets, cafes and restaurants, or foods not consumed due to waste or storage.
Daily per capita estimates are derived by dividing the annual total by the number of days in the reference year and dividing by the Estimated Resident Population (ERP). Data representing each financial year uses the ERP for December. For example, the 2020-21 estimates use ERP for December 2020. No adjustments have been made to the ERP for foods and non-alcoholic beverages that are typically consumed by selected age groups only, such as baby food.
Learn more about how Statista can support your business.
Australian Bureau of Statistics. (April 12, 2024). Estimated average daily macronutrient intake per capita in Australia in financial year 2023, by type (in grams) [Graph]. In Statista. Retrieved June 26, 2025, from https://www.statista.com/statistics/1172045/australia-estimated-mean-daily-macronutrient-intake-per-capita-by-type/
Australian Bureau of Statistics. "Estimated average daily macronutrient intake per capita in Australia in financial year 2023, by type (in grams) ." Chart. April 12, 2024. Statista. Accessed June 26, 2025. https://www.statista.com/statistics/1172045/australia-estimated-mean-daily-macronutrient-intake-per-capita-by-type/
Australian Bureau of Statistics. (2024). Estimated average daily macronutrient intake per capita in Australia in financial year 2023, by type (in grams) . Statista. Statista Inc.. Accessed: June 26, 2025. https://www.statista.com/statistics/1172045/australia-estimated-mean-daily-macronutrient-intake-per-capita-by-type/
Australian Bureau of Statistics. "Estimated Average Daily Macronutrient Intake per Capita in Australia in Financial Year 2023, by Type (in Grams) ." Statista, Statista Inc., 12 Apr 2024, https://www.statista.com/statistics/1172045/australia-estimated-mean-daily-macronutrient-intake-per-capita-by-type/
Australian Bureau of Statistics, Estimated average daily macronutrient intake per capita in Australia in financial year 2023, by type (in grams) Statista, https://www.statista.com/statistics/1172045/australia-estimated-mean-daily-macronutrient-intake-per-capita-by-type/ (last visited June 26, 2025)
Estimated average daily macronutrient intake per capita in Australia in financial year 2023, by type (in grams) [Graph], Australian Bureau of Statistics, April 12, 2024. [Online]. Available: https://www.statista.com/statistics/1172045/australia-estimated-mean-daily-macronutrient-intake-per-capita-by-type/
Advertisement
Profit from additional features with an Employee Account
Please create an employee account to be able to mark statistics as favorites.
Then you can access your favorite statistics via the star in the header.
Profit from the additional features of your individual account
Currently, you are using a shared account. To use individual functions (e.g., mark statistics as favourites, set
statistic alerts) please log in with your personal account.
If you are an admin, please authenticate by logging in again.