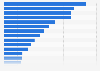
In Brazil, nearly two-thirds (66 percent) of companies surveyed in 2022 stated that the majority of the chatterbots they developed that year were used in customer service. Back office support ranked second, mentioned by 11 percent of the responding companies, while sales ranked third for 9 percent of the interviewees.
Advertisement
Advertisement
Leading uses of chatbots in Brazil as of July 2022
Profit from the additional features of your individual account
Currently, you are using a shared account. To use individual functions (e.g., mark statistics as favourites, set
statistic alerts) please log in with your personal account.
If you are an admin, please authenticate by logging in again.
Learn more about how Statista can support your business.
Mobile Time, & Opinion Box. (August 10, 2022). Leading uses of chatbots in Brazil as of July 2022 [Graph]. In Statista. Retrieved June 17, 2025, from https://www.statista.com/statistics/1173396/brazil-use-chatbots/
Mobile Time, und Opinion Box. "Leading uses of chatbots in Brazil as of July 2022." Chart. August 10, 2022. Statista. Accessed June 17, 2025. https://www.statista.com/statistics/1173396/brazil-use-chatbots/
Mobile Time, Opinion Box. (2022). Leading uses of chatbots in Brazil as of July 2022. Statista. Statista Inc.. Accessed: June 17, 2025. https://www.statista.com/statistics/1173396/brazil-use-chatbots/
Mobile Time, and Opinion Box. "Leading Uses of Chatbots in Brazil as of July 2022." Statista, Statista Inc., 10 Aug 2022, https://www.statista.com/statistics/1173396/brazil-use-chatbots/
Mobile Time & Opinion Box, Leading uses of chatbots in Brazil as of July 2022 Statista, https://www.statista.com/statistics/1173396/brazil-use-chatbots/ (last visited June 17, 2025)
Leading uses of chatbots in Brazil as of July 2022 [Graph], Mobile Time, & Opinion Box, August 10, 2022. [Online]. Available: https://www.statista.com/statistics/1173396/brazil-use-chatbots/