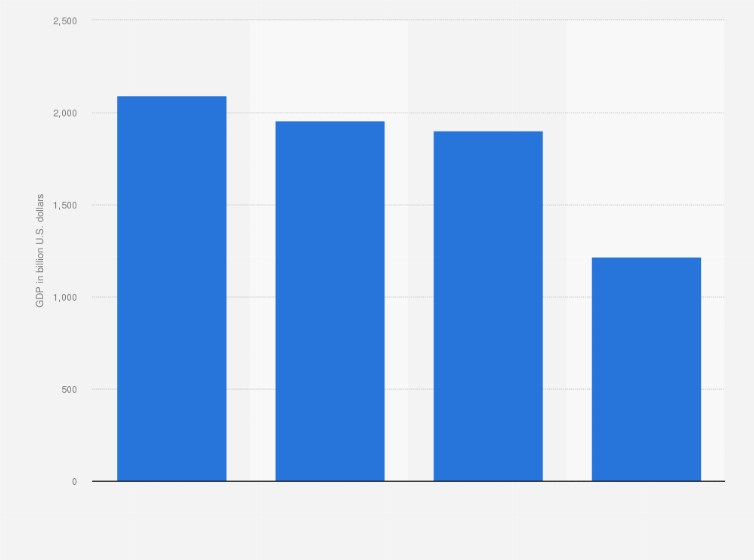
In 2021, the gross domestic product (GDP) of the Guangdong - Hong Kong - Macao Greater Bay Area reached around
****
Log in or register to access precise data.
trillion U.S. dollars. Although this was not much less than the GDP of the Tokyo Bay and more than the New York Metropolitan Area, per capita GDP in China's Greater Bay Area was considerably lower.
Adjust the presentation of the statistic and data points.
Share the statistic on social media channels or embed the statistic in your
website using "Embed Code", where available.
Cite this statistic and select one of the following formats: APA, Chicago, Harvard, MLA & Bluebook.
Print the statistic including description and metadata.
Chart type
GDP of the Guangdong-Hong Kong-Macao Greater Bay Area in comparison to the world's major bay areas in 2021
Share this statistic
You have no right to use this feature.
Make sure to contact us if you are interested in scientific citation.
You can upgrade your account to enable this functionality for all statistics.
This feature is not available with your current account.Request access
The Greater Bay Area is the Chinese government's scheme linking the cities of Hong Kong, Macau, Guangzhou, Shenzhen, Zhuhai, Foshan, Zhongshan, Dongguan, Huizhou, Jiangmen, and Zhaoqing into an integrated economic and business hub.
Values have been converted with the yearly average exchange rates.
Learn more about how Statista can support your business.
HKTDC. (August 27, 2024). GDP of the Guangdong-Hong Kong-Macao Greater Bay Area in comparison to the world's major bay areas in 2021 (in billion U.S. dollars) [Graph]. In Statista. Retrieved July 11, 2025, from https://www.statista.com/statistics/1173989/china-gross-domestic-product-gdp-of-the-greater-bay-area-in-global-comparison/
HKTDC. "GDP of the Guangdong-Hong Kong-Macao Greater Bay Area in comparison to the world's major bay areas in 2021 (in billion U.S. dollars)." Chart. August 27, 2024. Statista. Accessed July 11, 2025. https://www.statista.com/statistics/1173989/china-gross-domestic-product-gdp-of-the-greater-bay-area-in-global-comparison/
HKTDC. (2024). GDP of the Guangdong-Hong Kong-Macao Greater Bay Area in comparison to the world's major bay areas in 2021 (in billion U.S. dollars). Statista. Statista Inc.. Accessed: July 11, 2025. https://www.statista.com/statistics/1173989/china-gross-domestic-product-gdp-of-the-greater-bay-area-in-global-comparison/
HKTDC. "Gdp of The Guangdong-hong Kong-macao Greater Bay Area in Comparison to The World's Major Bay Areas in 2021 (in Billion U.S. Dollars)." Statista, Statista Inc., 27 Aug 2024, https://www.statista.com/statistics/1173989/china-gross-domestic-product-gdp-of-the-greater-bay-area-in-global-comparison/
HKTDC, GDP of the Guangdong-Hong Kong-Macao Greater Bay Area in comparison to the world's major bay areas in 2021 (in billion U.S. dollars) Statista, https://www.statista.com/statistics/1173989/china-gross-domestic-product-gdp-of-the-greater-bay-area-in-global-comparison/ (last visited July 11, 2025)
GDP of the Guangdong-Hong Kong-Macao Greater Bay Area in comparison to the world's major bay areas in 2021 (in billion U.S. dollars) [Graph], HKTDC, August 27, 2024. [Online]. Available: https://www.statista.com/statistics/1173989/china-gross-domestic-product-gdp-of-the-greater-bay-area-in-global-comparison/
Advertisement
Profit from additional features with an Employee Account
Please create an employee account to be able to mark statistics as favorites.
Then you can access your favorite statistics via the star in the header.
Profit from the additional features of your individual account
Currently, you are using a shared account. To use individual functions (e.g., mark statistics as favourites, set
statistic alerts) please log in with your personal account.
If you are an admin, please authenticate by logging in again.