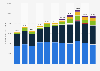
After usually being between 700 and 800 from 2012 to 2017, the number of reported robberies in shops in Sweden were around 500 from 2018 to 2020. Moreover, in 2022, the number fell below 400. The decreasing number of robberies in shops must be seen in relation with the digitalization of the payment system in Sweden. Of the robberies in shops in 2022, 334 were unarmed.
Number of robberies in shops in Sweden from 2012 to 2022
Characteristic
Armed
Unarmed
2022
60
334
2021
73
345
2020
114
440
2019
115
380
2018
129
386
2017
271
453
2016
296
531
2015
316
501
2014
218
558
2013
269
542
2012
222
512
02004006008001,000
Add this content to your personal favorites. These can be accessed from the favorites menu in the main navigation.
You have no right to use this feature.
Make sure to contact us if you are interested in scientific citation.
You can upgrade your account to enable this functionality for all statistics.
This feature is not available with your current account.Request access
Learn more about how Statista can support your business.
The Swedish National Council for Crime Prevention . (May 8, 2023). Number of robberies in shops in Sweden from 2012 to 2022 [Graph]. In Statista. Retrieved June 05, 2025, from https://www.statista.com/statistics/1177573/number-of-robberies-in-shops-in-sweden/
The Swedish National Council for Crime Prevention . "Number of robberies in shops in Sweden from 2012 to 2022." Chart. May 8, 2023. Statista. Accessed June 05, 2025. https://www.statista.com/statistics/1177573/number-of-robberies-in-shops-in-sweden/
The Swedish National Council for Crime Prevention . (2023). Number of robberies in shops in Sweden from 2012 to 2022. Statista. Statista Inc.. Accessed: June 05, 2025. https://www.statista.com/statistics/1177573/number-of-robberies-in-shops-in-sweden/
The Swedish National Council for Crime Prevention . "Number of Robberies in Shops in Sweden from 2012 to 2022." Statista, Statista Inc., 8 May 2023, https://www.statista.com/statistics/1177573/number-of-robberies-in-shops-in-sweden/
The Swedish National Council for Crime Prevention , Number of robberies in shops in Sweden from 2012 to 2022 Statista, https://www.statista.com/statistics/1177573/number-of-robberies-in-shops-in-sweden/ (last visited June 05, 2025)
Number of robberies in shops in Sweden from 2012 to 2022 [Graph], The Swedish National Council for Crime Prevention , May 8, 2023. [Online]. Available: https://www.statista.com/statistics/1177573/number-of-robberies-in-shops-in-sweden/
Profit from additional features with an Employee Account
Please create an employee account to be able to mark statistics as favorites.
Then you can access your favorite statistics via the star in the header.
Profit from the additional features of your individual account
Currently, you are using a shared account. To use individual functions (e.g., mark statistics as favourites, set
statistic alerts) please log in with your personal account.
If you are an admin, please authenticate by logging in again.