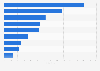
In 2021, SPAC IPOs in the United States raised almost twice as much as they raised in the previous year, reaching approximately 162 billion U.S. dollars. In 2022, proceeds of SPAC IPOs surpassed 2017 and 2018 levels, however remained significantly lower than the last two years. A special purpose acquisition company (SPAC) is a company with no business operations which is set up for the sole purpose of raising capital through an initial public offering with the goal of buying an existing company. 2020 was a significant year for SPACs with a dramatic increase in the number of IPOs.
Proceeds of special purpose acquisition company (SPAC) IPOs in the United States from 2003 to 2024
(in million U.S. dollars)
Profit from the additional features of your individual account
Currently, you are using a shared account. To use individual functions (e.g., mark statistics as favourites, set
statistic alerts) please log in with your personal account.
If you are an admin, please authenticate by logging in again.
Learn more about how Statista can support your business.
SPAC Analytics. (January 30, 2025). Proceeds of special purpose acquisition company (SPAC) IPOs in the United States from 2003 to 2024 (in million U.S. dollars) [Graph]. In Statista. Retrieved June 09, 2025, from https://www.statista.com/statistics/1178273/size-spac-ipo-usa/
SPAC Analytics. "Proceeds of special purpose acquisition company (SPAC) IPOs in the United States from 2003 to 2024 (in million U.S. dollars)." Chart. January 30, 2025. Statista. Accessed June 09, 2025. https://www.statista.com/statistics/1178273/size-spac-ipo-usa/
SPAC Analytics. (2025). Proceeds of special purpose acquisition company (SPAC) IPOs in the United States from 2003 to 2024 (in million U.S. dollars). Statista. Statista Inc.. Accessed: June 09, 2025. https://www.statista.com/statistics/1178273/size-spac-ipo-usa/
SPAC Analytics. "Proceeds of Special Purpose Acquisition Company (Spac) Ipos in The United States from 2003 to 2024 (in Million U.S. Dollars)." Statista, Statista Inc., 30 Jan 2025, https://www.statista.com/statistics/1178273/size-spac-ipo-usa/
SPAC Analytics, Proceeds of special purpose acquisition company (SPAC) IPOs in the United States from 2003 to 2024 (in million U.S. dollars) Statista, https://www.statista.com/statistics/1178273/size-spac-ipo-usa/ (last visited June 09, 2025)
Proceeds of special purpose acquisition company (SPAC) IPOs in the United States from 2003 to 2024 (in million U.S. dollars) [Graph], SPAC Analytics, January 30, 2025. [Online]. Available: https://www.statista.com/statistics/1178273/size-spac-ipo-usa/