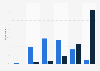
In 2023, a survey found that around 77.5 percent of housing in Sejong in South Korea were apartments. The average share of housing that were apartments within the country was at around 52.4 percent that year.
Advertisement
Advertisement
Share of housing in Sejong in South Korea in 2023, by type
Profit from the additional features of your individual account
Currently, you are using a shared account. To use individual functions (e.g., mark statistics as favourites, set
statistic alerts) please log in with your personal account.
If you are an admin, please authenticate by logging in again.
Learn more about how Statista can support your business.
KOSIS. (January 13, 2025). Share of housing in Sejong in South Korea in 2023, by type [Graph]. In Statista. Retrieved June 17, 2025, from https://www.statista.com/statistics/1185129/south-korea-housing-types-sejong/
KOSIS. "Share of housing in Sejong in South Korea in 2023, by type." Chart. January 13, 2025. Statista. Accessed June 17, 2025. https://www.statista.com/statistics/1185129/south-korea-housing-types-sejong/
KOSIS. (2025). Share of housing in Sejong in South Korea in 2023, by type. Statista. Statista Inc.. Accessed: June 17, 2025. https://www.statista.com/statistics/1185129/south-korea-housing-types-sejong/
KOSIS. "Share of Housing in Sejong in South Korea in 2023, by Type." Statista, Statista Inc., 13 Jan 2025, https://www.statista.com/statistics/1185129/south-korea-housing-types-sejong/
KOSIS, Share of housing in Sejong in South Korea in 2023, by type Statista, https://www.statista.com/statistics/1185129/south-korea-housing-types-sejong/ (last visited June 17, 2025)
Share of housing in Sejong in South Korea in 2023, by type [Graph], KOSIS, January 13, 2025. [Online]. Available: https://www.statista.com/statistics/1185129/south-korea-housing-types-sejong/