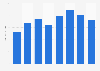
The combined revenue in the non-alcoholic drinks market in Russia was forecast to continuously increase between 2025 and 2029 by in total 1.2 billion U.S. dollars (+8.97 percent). According to this forecast, in 2029, the combined revenue will have increased for the sixth consecutive year to 14.3 billion U.S. dollars.
Data provided by Statista Market Insights are estimates.
Definition:
The Non-Alcoholic Drinks market includes all beverages without alcohol. The beverages combined in this market are also often called liquid refreshment beverages (LRB).
Structure:
The Non-Alcoholic Drinks market consists of five markets:
Bottled Water includes carbonated and non-carbonated water which is sold in bottles or via water dispensers.
Soft Drinks covers water-based Non-Alcoholic Drinks, this market consists of Carbonated Soft Drinks and Non-Carbonated Soft Drinks.
The Energy & Sports Drinks market focusses on functional beverages designed to enhance energy, performance, and recovery. The market also contains protein powder.
The Juices market consists of all types of bottled fruit and vegetable juices which contain 100% fruit and/or vegetable juice. The juices market is divided into Orange Juice, Apple Juice, Grapefruit Juice, Pineapple Juice, Grape Juice, and Other Juice, Juice Mixtures & Smoothies.
The Ready-to-Drink (RTD) Coffee & Tea market includes packaged coffee and tea beverages in liquid form, ready for consumption. This market is further split into Ready-to-Drink (RTD) Coffee and Ready-to-Drink (RTD) Tea.
Additional information:
The market comprises revenue and average revenue per capita, volume and average volume per capita, price per liter, as well as sales channels. Per capita figures refer to a country’s or region’s whole population.
The at-home market covers retail sales via super- and hypermarkets, eCommerce, convenience stores, or similar sales channels. The out-of-home data encompasses all sales to hotels, restaurants, catering, cafés, bars, and similar hospitality service establishments. Combined numbers encompass both the at-home market and the out-of-home market. Both the at-home and the out-of-home market are valued at retail selling prices including all sales and consumption taxes.
Key players include The Coca-Cola Company, PepsiCo, Red Bull, Danone, and Keurig Dr Pepper.
Profit from the additional features of your individual account
Currently, you are using a shared account. To use individual functions (e.g., mark statistics as favourites, set
statistic alerts) please log in with your personal account.
If you are an admin, please authenticate by logging in again.
Learn more about how Statista can support your business.
Statista. (April 4, 2025). Revenue of the non-alcoholic drinks market in Russia from 2020 to 2029 (in million U.S. dollars) [Graph]. In Statista. Retrieved July 05, 2025, from https://www.statista.com/statistics/1201092/revenue-non-alcoholic-drinks-russia/
Statista. "Revenue of the non-alcoholic drinks market in Russia from 2020 to 2029 (in million U.S. dollars)." Chart. April 4, 2025. Statista. Accessed July 05, 2025. https://www.statista.com/statistics/1201092/revenue-non-alcoholic-drinks-russia/
Statista. (2025). Revenue of the non-alcoholic drinks market in Russia from 2020 to 2029 (in million U.S. dollars). Statista. Statista Inc.. Accessed: July 05, 2025. https://www.statista.com/statistics/1201092/revenue-non-alcoholic-drinks-russia/
Statista. "Revenue of The Non-alcoholic Drinks Market in Russia from 2020 to 2029 (in Million U.S. Dollars)." Statista, Statista Inc., 4 Apr 2025, https://www.statista.com/statistics/1201092/revenue-non-alcoholic-drinks-russia/
Statista, Revenue of the non-alcoholic drinks market in Russia from 2020 to 2029 (in million U.S. dollars) Statista, https://www.statista.com/statistics/1201092/revenue-non-alcoholic-drinks-russia/ (last visited July 05, 2025)
Revenue of the non-alcoholic drinks market in Russia from 2020 to 2029 (in million U.S. dollars) [Graph], Statista, April 4, 2025. [Online]. Available: https://www.statista.com/statistics/1201092/revenue-non-alcoholic-drinks-russia/