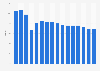
Digital lending is one of the fastest-growing fintech segments in India and grew exponentially from nine billion U.S. dollars in 2012 to nearly 150 billion dollars in 2020. It was expected that the digital lending market would reach a value of around 350 billion dollars by 2023. This business was mainly covered by fintech startups and non-banking financial companies (NBFC).
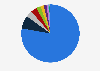
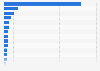
Digital lending companies in India
Digital lending companies provide comparatively small loans to their customers through apps or online platforms. In comparison to bank loans, digital lending does not require a specific bank account, requirements are lower, and the process is significantly quicker. Digital lending start-ups are increasingly becoming popular among customers and aim to meet the credit gap.
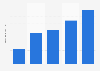
Funding the MSME sector
Besides providing loans for individuals, lending companies also served micro, small, and medium enterprises (MSME). An already high credit demand in this sector was fueled by the coronavirus (COVID-19) pandemic. Many enterprises were not eligible for banking loans and had to look for alternative funding.
Advertisement
Advertisement
Value of digital lending market in India from 2012 to 2020, with estimates until 2023
(in billion U.S. dollars)
Profit from the additional features of your individual account
Currently, you are using a shared account. To use individual functions (e.g., mark statistics as favourites, set
statistic alerts) please log in with your personal account.
If you are an admin, please authenticate by logging in again.
Learn more about how Statista can support your business.
EY. (October 17, 2021). Value of digital lending market in India from 2012 to 2020, with estimates until 2023 (in billion U.S. dollars) [Graph]. In Statista. Retrieved June 24, 2025, from https://www.statista.com/statistics/1202533/india-digital-lending-volume/
EY. "Value of digital lending market in India from 2012 to 2020, with estimates until 2023 (in billion U.S. dollars)." Chart. October 17, 2021. Statista. Accessed June 24, 2025. https://www.statista.com/statistics/1202533/india-digital-lending-volume/
EY. (2021). Value of digital lending market in India from 2012 to 2020, with estimates until 2023 (in billion U.S. dollars). Statista. Statista Inc.. Accessed: June 24, 2025. https://www.statista.com/statistics/1202533/india-digital-lending-volume/
EY. "Value of Digital Lending Market in India from 2012 to 2020, with Estimates until 2023 (in Billion U.S. Dollars)." Statista, Statista Inc., 17 Oct 2021, https://www.statista.com/statistics/1202533/india-digital-lending-volume/
EY, Value of digital lending market in India from 2012 to 2020, with estimates until 2023 (in billion U.S. dollars) Statista, https://www.statista.com/statistics/1202533/india-digital-lending-volume/ (last visited June 24, 2025)
Value of digital lending market in India from 2012 to 2020, with estimates until 2023 (in billion U.S. dollars) [Graph], EY, October 17, 2021. [Online]. Available: https://www.statista.com/statistics/1202533/india-digital-lending-volume/