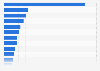
Municipalities and groups of municipalities invested, on average, the most per capita in cycling investments. In 2019, this amount represented almost *** euros per inhabitant. This figure is an average of the investments made by the *** cities that responded to the questionnaires.
In the same year, the investment of the regions was less than *** euro per inhabitant.
* Among the 523 territorial administrations, 14 regions, 92 departments and 374 municipalities and groupings of municipalities, participated in the survey.
Methodology: The questionnaire consisted of over 100 questions on all topics related to community cycling policy.
Profit from the additional features of your individual account
Currently, you are using a shared account. To use individual functions (e.g., mark statistics as favourites, set
statistic alerts) please log in with your personal account.
If you are an admin, please authenticate by logging in again.
Learn more about how Statista can support your business.
Vélo & Territoires. (January 17, 2020). Average expenditure on cycling investment in France in 2019, by administrative division (in euros per capita) [Graph]. In Statista. Retrieved July 15, 2025, from https://www.statista.com/statistics/1219414/spending-per-capita-cycling-investment-france/
Vélo & Territoires. "Average expenditure on cycling investment in France in 2019, by administrative division (in euros per capita)." Chart. January 17, 2020. Statista. Accessed July 15, 2025. https://www.statista.com/statistics/1219414/spending-per-capita-cycling-investment-france/
Vélo & Territoires. (2020). Average expenditure on cycling investment in France in 2019, by administrative division (in euros per capita). Statista. Statista Inc.. Accessed: July 15, 2025. https://www.statista.com/statistics/1219414/spending-per-capita-cycling-investment-france/
Vélo & Territoires. "Average Expenditure on Cycling Investment in France in 2019, by Administrative Division (in Euros per Capita)." Statista, Statista Inc., 17 Jan 2020, https://www.statista.com/statistics/1219414/spending-per-capita-cycling-investment-france/
Vélo & Territoires, Average expenditure on cycling investment in France in 2019, by administrative division (in euros per capita) Statista, https://www.statista.com/statistics/1219414/spending-per-capita-cycling-investment-france/ (last visited July 15, 2025)
Average expenditure on cycling investment in France in 2019, by administrative division (in euros per capita) [Graph], Vélo & Territoires, January 17, 2020. [Online]. Available: https://www.statista.com/statistics/1219414/spending-per-capita-cycling-investment-france/