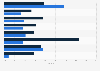
In 2023, the total spend on retail in Australia topped *** billion Australian dollars, compared to just over ** billion dollars in online sales. The value of physical retail sales has been increasing since 2018, and online sales grew until 2022, witnessing a marginal decline in 2023. Offline retail has consistently recorded a larger share of sales each year.
Profit from the additional features of your individual account
Currently, you are using a shared account. To use individual functions (e.g., mark statistics as favourites, set
statistic alerts) please log in with your personal account.
If you are an admin, please authenticate by logging in again.
Learn more about how Statista can support your business.
Australia Post. (March 18, 2024). Total spending on goods sold in Australia from 2018 to 2023, by mode of purchase (in billion Australian dollars) [Graph]. In Statista. Retrieved June 28, 2025, from https://www.statista.com/statistics/1220095/australia-annual-goods-sales-value-by-mode-of-purchase/
Australia Post. "Total spending on goods sold in Australia from 2018 to 2023, by mode of purchase (in billion Australian dollars)." Chart. March 18, 2024. Statista. Accessed June 28, 2025. https://www.statista.com/statistics/1220095/australia-annual-goods-sales-value-by-mode-of-purchase/
Australia Post. (2024). Total spending on goods sold in Australia from 2018 to 2023, by mode of purchase (in billion Australian dollars). Statista. Statista Inc.. Accessed: June 28, 2025. https://www.statista.com/statistics/1220095/australia-annual-goods-sales-value-by-mode-of-purchase/
Australia Post. "Total Spending on Goods Sold in Australia from 2018 to 2023, by Mode of Purchase (in Billion Australian Dollars)." Statista, Statista Inc., 18 Mar 2024, https://www.statista.com/statistics/1220095/australia-annual-goods-sales-value-by-mode-of-purchase/
Australia Post, Total spending on goods sold in Australia from 2018 to 2023, by mode of purchase (in billion Australian dollars) Statista, https://www.statista.com/statistics/1220095/australia-annual-goods-sales-value-by-mode-of-purchase/ (last visited June 28, 2025)
Total spending on goods sold in Australia from 2018 to 2023, by mode of purchase (in billion Australian dollars) [Graph], Australia Post, March 18, 2024. [Online]. Available: https://www.statista.com/statistics/1220095/australia-annual-goods-sales-value-by-mode-of-purchase/