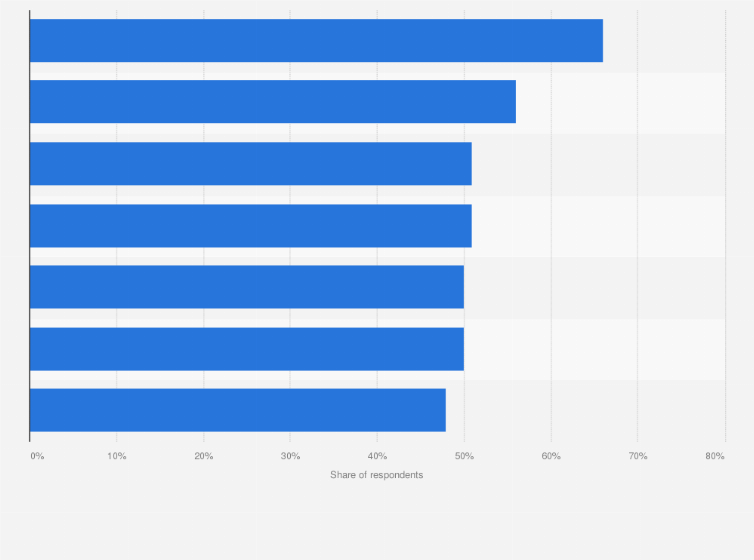
The results of a survey conducted in November 2020 revealed around two out of three Chinese consumers went grocery shopping in physical stores the same or more within the past six months. Meanwhile, approximately 56 percent of surveyed consumers maintained or increased their offline spending on household appliances, including freezers and microwaves.
Share of respondents making the same or more in-store purchases in selected product categories in China as of November 2020
Adjust the presentation of the statistic and data points.
Share the statistic on social media channels or embed the statistic in your
website using "Embed Code", where available.
Cite this statistic and select one of the following formats: APA, Chicago, Harvard, MLA & Bluebook.
Print the statistic including description and metadata.
Chart type
Share of respondents making the same or more in-store purchases in selected product categories in China as of November 2020
Share this statistic
You have no right to use this feature.
Make sure to contact us if you are interested in scientific citation.
You can upgrade your account to enable this functionality for all statistics.
This feature is not available with your current account.Request access
among respondents who shopped online at least once in the previous year
Method of interview
Online survey
Supplementary notes
Original survey question:
"Considering the following product categories, how has the way you shop in store changed, if at all, in the past six months? Shopping in-store the same or more"
Learn more about how Statista can support your business.
PwC. (March 30, 2021). Share of respondents making the same or more in-store purchases in selected product categories in China as of November 2020 [Graph]. In Statista. Retrieved May 05, 2025, from https://www.statista.com/statistics/1231218/china-increases-in-offline-shopping-by-product-category/
PwC. "Share of respondents making the same or more in-store purchases in selected product categories in China as of November 2020." Chart. March 30, 2021. Statista. Accessed May 05, 2025. https://www.statista.com/statistics/1231218/china-increases-in-offline-shopping-by-product-category/
PwC. (2021). Share of respondents making the same or more in-store purchases in selected product categories in China as of November 2020. Statista. Statista Inc.. Accessed: May 05, 2025. https://www.statista.com/statistics/1231218/china-increases-in-offline-shopping-by-product-category/
PwC. "Share of Respondents Making The Same or More In-store Purchases in Selected Product Categories in China as of November 2020." Statista, Statista Inc., 30 Mar 2021, https://www.statista.com/statistics/1231218/china-increases-in-offline-shopping-by-product-category/
PwC, Share of respondents making the same or more in-store purchases in selected product categories in China as of November 2020 Statista, https://www.statista.com/statistics/1231218/china-increases-in-offline-shopping-by-product-category/ (last visited May 05, 2025)
Share of respondents making the same or more in-store purchases in selected product categories in China as of November 2020 [Graph], PwC, March 30, 2021. [Online]. Available: https://www.statista.com/statistics/1231218/china-increases-in-offline-shopping-by-product-category/
Profit from additional features with an Employee Account
Please create an employee account to be able to mark statistics as favorites.
Then you can access your favorite statistics via the star in the header.
Profit from the additional features of your individual account
Currently, you are using a shared account. To use individual functions (e.g., mark statistics as favourites, set
statistic alerts) please log in with your personal account.
If you are an admin, please authenticate by logging in again.