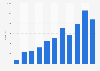
The Sumo Group, founded in 2003, is a video game developer company headquartered in the United Kingdom. The British company had a total annual revenue of million 68.95 British pounds in 2020, up from their 48.99 million annual revenue in the previous year.
Advertisement
Advertisement
Annual revenue generated by Sumo Group from 2018 to 2020
(in million GBP)
Characteristic
Million British pounds
2020
68.95
2019
48.99
2018
38.7
01020304050607080
Add this content to your personal favorites. These can be accessed from the favorites menu in the main navigation.
You have no right to use this feature.
Make sure to contact us if you are interested in scientific citation.
You can upgrade your account to enable this functionality for all statistics.
This feature is not available with your current account.Request access
Learn more about how Statista can support your business.
Sumo Group. (March 31, 2021). Annual revenue generated by Sumo Group from 2018 to 2020 (in million GBP) [Graph]. In Statista. Retrieved July 12, 2025, from https://www.statista.com/statistics/1232495/sumo-group-annual-revenue/
Sumo Group. "Annual revenue generated by Sumo Group from 2018 to 2020 (in million GBP)." Chart. March 31, 2021. Statista. Accessed July 12, 2025. https://www.statista.com/statistics/1232495/sumo-group-annual-revenue/
Sumo Group. (2021). Annual revenue generated by Sumo Group from 2018 to 2020 (in million GBP). Statista. Statista Inc.. Accessed: July 12, 2025. https://www.statista.com/statistics/1232495/sumo-group-annual-revenue/
Sumo Group. "Annual Revenue Generated by Sumo Group from 2018 to 2020 (in Million Gbp)." Statista, Statista Inc., 31 Mar 2021, https://www.statista.com/statistics/1232495/sumo-group-annual-revenue/
Sumo Group, Annual revenue generated by Sumo Group from 2018 to 2020 (in million GBP) Statista, https://www.statista.com/statistics/1232495/sumo-group-annual-revenue/ (last visited July 12, 2025)
Annual revenue generated by Sumo Group from 2018 to 2020 (in million GBP) [Graph], Sumo Group, March 31, 2021. [Online]. Available: https://www.statista.com/statistics/1232495/sumo-group-annual-revenue/
Advertisement
Profit from additional features with an Employee Account
Please create an employee account to be able to mark statistics as favorites.
Then you can access your favorite statistics via the star in the header.
Profit from the additional features of your individual account
Currently, you are using a shared account. To use individual functions (e.g., mark statistics as favourites, set
statistic alerts) please log in with your personal account.
If you are an admin, please authenticate by logging in again.