Take Two Interactive is a video game distribution company headquartered in the United States. The company is divided into different publishing labels depending on the type of games or target audience (Rockstar Games, 2K Games, Private Division and Social Point). Take-Two Interactive's global revenue from virtual currency, add-on content, and in-game purchases has shown a continuous increase since 2018. In the fiscal year 2025, Take-Two generated over 4.47 billion U.S. dollars in revenue through recurrent consumer spending, which translates to approximately 79.4 percent of the company's net revenue during the measured period. 2021 was the first year that add-on purchases accounted for the majority of TTE's revenues and show the development of the gaming industry monetization as a whole.
Advertisement
Advertisement
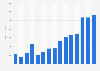
Share of net revenue generated by Take-Two Interactive through recurrent consumer spending from fiscal year 2017 to 2025
Characteristic
Share of net revenue
FY 2025
79.4%
FY 2024
78.8%
FY 2023
78.1%
FY 2022
64.8%
FY 2021
63.8%
FY 2020
46.9%
FY 2019
40.1%
FY 2018
41.6%
FY 2017
25.8%
0%20%40%60%80%100%
Add this content to your personal favorites. These can be accessed from the favorites menu in the main navigation.
You have no right to use this feature.
Make sure to contact us if you are interested in scientific citation.
You can upgrade your account to enable this functionality for all statistics.
This feature is not available with your current account.Request access
revenue from virtual currency, add-on content, and in-game purchases
Supplementary notes
Take-Two Interactive's fiscal year starts on April 1 and ends on March 31 of the following year.
Recurrent consumer spending ("RCS") is generated from ongoing consumer engagement and includes revenue from virtual currency, add-on content, in- game purchases, and in-game advertising.
Learn more about how Statista can support your business.
Take-Two Interactive. (May 15, 2025). Share of net revenue generated by Take-Two Interactive through recurrent consumer spending from fiscal year 2017 to 2025 [Graph]. In Statista. Retrieved July 08, 2025, from https://www.statista.com/statistics/1237756/revenue-take-two-interactive-content-recurrent-spent/
Take-Two Interactive. "Share of net revenue generated by Take-Two Interactive through recurrent consumer spending from fiscal year 2017 to 2025." Chart. May 15, 2025. Statista. Accessed July 08, 2025. https://www.statista.com/statistics/1237756/revenue-take-two-interactive-content-recurrent-spent/
Take-Two Interactive. (2025). Share of net revenue generated by Take-Two Interactive through recurrent consumer spending from fiscal year 2017 to 2025. Statista. Statista Inc.. Accessed: July 08, 2025. https://www.statista.com/statistics/1237756/revenue-take-two-interactive-content-recurrent-spent/
Take-Two Interactive. "Share of Net Revenue Generated by Take-two Interactive through Recurrent Consumer Spending from Fiscal Year 2017 to 2025." Statista, Statista Inc., 15 May 2025, https://www.statista.com/statistics/1237756/revenue-take-two-interactive-content-recurrent-spent/
Take-Two Interactive, Share of net revenue generated by Take-Two Interactive through recurrent consumer spending from fiscal year 2017 to 2025 Statista, https://www.statista.com/statistics/1237756/revenue-take-two-interactive-content-recurrent-spent/ (last visited July 08, 2025)
Share of net revenue generated by Take-Two Interactive through recurrent consumer spending from fiscal year 2017 to 2025 [Graph], Take-Two Interactive, May 15, 2025. [Online]. Available: https://www.statista.com/statistics/1237756/revenue-take-two-interactive-content-recurrent-spent/
Advertisement
Profit from additional features with an Employee Account
Please create an employee account to be able to mark statistics as favorites.
Then you can access your favorite statistics via the star in the header.
Profit from the additional features of your individual account
Currently, you are using a shared account. To use individual functions (e.g., mark statistics as favourites, set
statistic alerts) please log in with your personal account.
If you are an admin, please authenticate by logging in again.