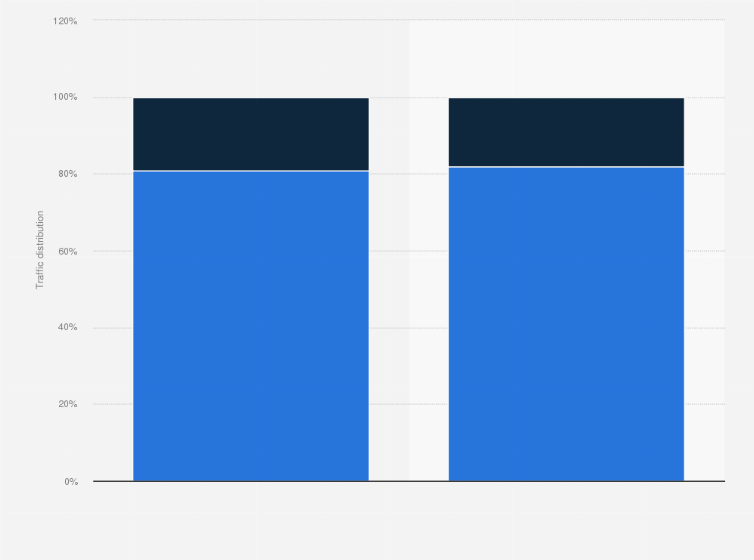
The distribution between passenger services and freight services in Europe remained stable between 2015 and 2019, with passenger transport representing over 80 percent of the regional traffic, compared to less than 20 percent of freight traffic.
Adjust the presentation of the statistic and data points.
Share the statistic on social media channels or embed the statistic in your
website using "Embed Code", where available.
Cite this statistic and select one of the following formats: APA, Chicago, Harvard, MLA & Bluebook.
Print the statistic including description and metadata.
Chart type
Breakdown of the European rail traffic between 2015 and 2019, by service
Share this statistic
You have no right to use this feature.
Make sure to contact us if you are interested in scientific citation.
You can upgrade your account to enable this functionality for all statistics.
This feature is not available with your current account.Request access
Learn more about how Statista can support your business.
IRG-Rail. (April 29, 2021). Breakdown of the European rail traffic between 2015 and 2019, by service [Graph]. In Statista. Retrieved June 17, 2025, from https://www.statista.com/statistics/1243387/europe-rail-traffic-distribution-by-service/
IRG-Rail. "Breakdown of the European rail traffic between 2015 and 2019, by service." Chart. April 29, 2021. Statista. Accessed June 17, 2025. https://www.statista.com/statistics/1243387/europe-rail-traffic-distribution-by-service/
IRG-Rail. (2021). Breakdown of the European rail traffic between 2015 and 2019, by service. Statista. Statista Inc.. Accessed: June 17, 2025. https://www.statista.com/statistics/1243387/europe-rail-traffic-distribution-by-service/
IRG-Rail. "Breakdown of The European Rail Traffic between 2015 and 2019, by Service." Statista, Statista Inc., 29 Apr 2021, https://www.statista.com/statistics/1243387/europe-rail-traffic-distribution-by-service/
IRG-Rail, Breakdown of the European rail traffic between 2015 and 2019, by service Statista, https://www.statista.com/statistics/1243387/europe-rail-traffic-distribution-by-service/ (last visited June 17, 2025)
Breakdown of the European rail traffic between 2015 and 2019, by service [Graph], IRG-Rail, April 29, 2021. [Online]. Available: https://www.statista.com/statistics/1243387/europe-rail-traffic-distribution-by-service/
Advertisement
Profit from additional features with an Employee Account
Please create an employee account to be able to mark statistics as favorites.
Then you can access your favorite statistics via the star in the header.
Profit from the additional features of your individual account
Currently, you are using a shared account. To use individual functions (e.g., mark statistics as favourites, set
statistic alerts) please log in with your personal account.
If you are an admin, please authenticate by logging in again.