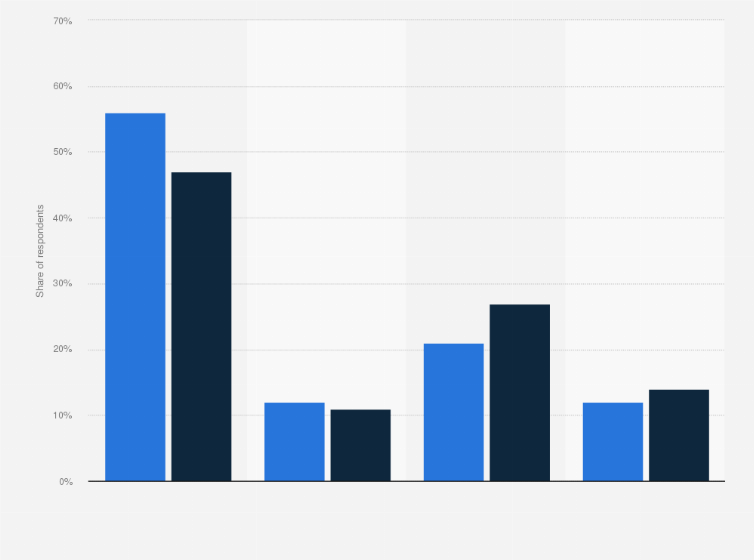
A survey conducted in May 2021 among consumers in the United States revealed that the most popular way of browsing for retail items was in person browsing, with 56 percent of female shoppers and 47 percent of male shoppers preferring this option. Browsing for retail items on a brand's website using a computer/laptop was the second most preferred method, which was slightly more popular among male consumers compared to female consumers.
Advertisement
Advertisement
Preferred methods for browsing retail items among consumers in the United States as of 2nd quarter 2021, by gender
Adjust the presentation of the statistic and data points.
Share the statistic on social media channels or embed the statistic in your
website using "Embed Code", where available.
Cite this statistic and select one of the following formats: APA, Chicago, Harvard, MLA & Bluebook.
Print the statistic including description and metadata.
Chart type
Preferred methods for browsing retail items among consumers in the United States as of 2nd quarter 2021, by gender
Share this statistic
You have no right to use this feature.
Make sure to contact us if you are interested in scientific citation.
You can upgrade your account to enable this functionality for all statistics.
This feature is not available with your current account.Request access
Learn more about how Statista can support your business.
InMobi. (June 16, 2021). Preferred methods for browsing retail items among consumers in the United States as of 2nd quarter 2021, by gender [Graph]. In Statista. Retrieved June 14, 2025, from https://www.statista.com/statistics/1246677/browsing-preference-for-retail-items-by-gender-us/
InMobi. "Preferred methods for browsing retail items among consumers in the United States as of 2nd quarter 2021, by gender." Chart. June 16, 2021. Statista. Accessed June 14, 2025. https://www.statista.com/statistics/1246677/browsing-preference-for-retail-items-by-gender-us/
InMobi. (2021). Preferred methods for browsing retail items among consumers in the United States as of 2nd quarter 2021, by gender. Statista. Statista Inc.. Accessed: June 14, 2025. https://www.statista.com/statistics/1246677/browsing-preference-for-retail-items-by-gender-us/
InMobi. "Preferred Methods for Browsing Retail Items among Consumers in The United States as of 2nd Quarter 2021, by Gender." Statista, Statista Inc., 16 Jun 2021, https://www.statista.com/statistics/1246677/browsing-preference-for-retail-items-by-gender-us/
InMobi, Preferred methods for browsing retail items among consumers in the United States as of 2nd quarter 2021, by gender Statista, https://www.statista.com/statistics/1246677/browsing-preference-for-retail-items-by-gender-us/ (last visited June 14, 2025)
Preferred methods for browsing retail items among consumers in the United States as of 2nd quarter 2021, by gender [Graph], InMobi, June 16, 2021. [Online]. Available: https://www.statista.com/statistics/1246677/browsing-preference-for-retail-items-by-gender-us/
Advertisement
Profit from additional features with an Employee Account
Please create an employee account to be able to mark statistics as favorites.
Then you can access your favorite statistics via the star in the header.
Profit from the additional features of your individual account
Currently, you are using a shared account. To use individual functions (e.g., mark statistics as favourites, set
statistic alerts) please log in with your personal account.
If you are an admin, please authenticate by logging in again.