In 2024, children and teenagers in the United States spent an average of 152 minutes playing Roblox games via their mobile devices. By comparison, weekly engagement levels with Minecraft app among players aged 18 and younger decreased from 48 daily minutes in 2023 to 40 minutes in 2024.
Advertisement
Advertisement
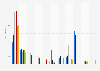
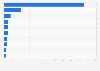
Average daily time spent by children in the United States on leading gaming apps from 2019 to 2024
(in minutes)
Characteristic
2019
2020
2021
2022
2023
2024
Brawl Stars
-
-
-
-
-
25
Subway Surfers
-
-
-
-
-
11
Magic Tiles 3
-
-
11
14
8
11
Pokemon GO
-
-
23
16
18
-
What Would you choose? Rather
-
11
5
5
-
-
Clash of Clans
-
13
22
19
-
-
Clash Royale
23
18
40
35
18
18
Minecraft
53
49
36
49
48
40
Among US
25
37
61
74
18
-
Roblox
83
100
180
190
139
152
050100150200250
Add this content to your personal favorites. These can be accessed from the favorites menu in the main navigation.
You have no right to use this feature.
Make sure to contact us if you are interested in scientific citation.
You can upgrade your account to enable this functionality for all statistics.
This feature is not available with your current account.Request access
According to the source: "This report is based on anonymous information provided by 400,000 families with children aged 4-18 years old from around the world, along with deeper insights from children in the United States, the United Kingdom, France, Spain, and Australia."
No data available for missing years on selected gaming apps
Learn more about how Statista can support your business.
Qustodio. (January 21, 2025). Average daily time spent by children in the United States on leading gaming apps from 2019 to 2024 (in minutes) [Graph]. In Statista. Retrieved July 26, 2025, from https://www.statista.com/statistics/1249021/us-time-spent-by-children-on-gaming-apps/
Qustodio. "Average daily time spent by children in the United States on leading gaming apps from 2019 to 2024 (in minutes)." Chart. January 21, 2025. Statista. Accessed July 26, 2025. https://www.statista.com/statistics/1249021/us-time-spent-by-children-on-gaming-apps/
Qustodio. (2025). Average daily time spent by children in the United States on leading gaming apps from 2019 to 2024 (in minutes). Statista. Statista Inc.. Accessed: July 26, 2025. https://www.statista.com/statistics/1249021/us-time-spent-by-children-on-gaming-apps/
Qustodio. "Average Daily Time Spent by Children in The United States on Leading Gaming Apps from 2019 to 2024 (in Minutes)." Statista, Statista Inc., 21 Jan 2025, https://www.statista.com/statistics/1249021/us-time-spent-by-children-on-gaming-apps/
Qustodio, Average daily time spent by children in the United States on leading gaming apps from 2019 to 2024 (in minutes) Statista, https://www.statista.com/statistics/1249021/us-time-spent-by-children-on-gaming-apps/ (last visited July 26, 2025)
Average daily time spent by children in the United States on leading gaming apps from 2019 to 2024 (in minutes) [Graph], Qustodio, January 21, 2025. [Online]. Available: https://www.statista.com/statistics/1249021/us-time-spent-by-children-on-gaming-apps/
Advertisement
Profit from additional features with an Employee Account
Please create an employee account to be able to mark statistics as favorites.
Then you can access your favorite statistics via the star in the header.
Profit from the additional features of your individual account
Currently, you are using a shared account. To use individual functions (e.g., mark statistics as favourites, set
statistic alerts) please log in with your personal account.
If you are an admin, please authenticate by logging in again.