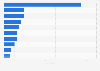
At over 3.4 billion U.S. dollars, buses amounted for the largest rolling stock capital expenditures in the United States in 2018. This was over half of the total spending that same year, dwarfing all other segments. Heavy rail, second in the ranking, made up around 13.5 percent of the expenses.
Advertisement
Advertisement
Rolling stock capital expenditures of the United States in 2018, by segment
(in million U.S. dollars)
Profit from the additional features of your individual account
Currently, you are using a shared account. To use individual functions (e.g., mark statistics as favourites, set
statistic alerts) please log in with your personal account.
If you are an admin, please authenticate by logging in again.
Learn more about how Statista can support your business.
APTA. (March 6, 2020). Rolling stock capital expenditures of the United States in 2018, by segment (in million U.S. dollars) [Graph]. In Statista. Retrieved June 27, 2025, from https://www.statista.com/statistics/1250555/united-states-rolling-stock-capital-expenditures-by-segment/
APTA. "Rolling stock capital expenditures of the United States in 2018, by segment (in million U.S. dollars)." Chart. March 6, 2020. Statista. Accessed June 27, 2025. https://www.statista.com/statistics/1250555/united-states-rolling-stock-capital-expenditures-by-segment/
APTA. (2020). Rolling stock capital expenditures of the United States in 2018, by segment (in million U.S. dollars). Statista. Statista Inc.. Accessed: June 27, 2025. https://www.statista.com/statistics/1250555/united-states-rolling-stock-capital-expenditures-by-segment/
APTA. "Rolling Stock Capital Expenditures of The United States in 2018, by Segment (in Million U.S. Dollars)." Statista, Statista Inc., 6 Mar 2020, https://www.statista.com/statistics/1250555/united-states-rolling-stock-capital-expenditures-by-segment/
APTA, Rolling stock capital expenditures of the United States in 2018, by segment (in million U.S. dollars) Statista, https://www.statista.com/statistics/1250555/united-states-rolling-stock-capital-expenditures-by-segment/ (last visited June 27, 2025)
Rolling stock capital expenditures of the United States in 2018, by segment (in million U.S. dollars) [Graph], APTA, March 6, 2020. [Online]. Available: https://www.statista.com/statistics/1250555/united-states-rolling-stock-capital-expenditures-by-segment/