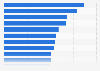
Among all occupational groups in Iceland, men have higher average wages than women. Managers was the occupational group with the highest average earnings in 2022, with men earning around 1.3 million Icelandic krona per month, compared to women's 1.1 million. Elementary occupations was the group with the lowest average earnings, with men and women earning 480,000 and 480,000 Icelandic krona per month, respectively. There is a significant income gap between the genders in Iceland.
Average regular earnings in Iceland per month by occupation and gender in 2022
(in 1,000 ISK)
You have no right to use this feature.
Make sure to contact us if you are interested in scientific citation.
You can upgrade your account to enable this functionality for all statistics.
This feature is not available with your current account.Request access
Learn more about how Statista can support your business.
Statistics Iceland. (May 5, 2023). Average regular earnings in Iceland per month by occupation and gender in 2022 (in 1,000 ISK) [Graph]. In Statista. Retrieved May 06, 2025, from https://www.statista.com/statistics/1260646/regular-earnings-in-iceland-by-occupation-and-gender/
Statistics Iceland. "Average regular earnings in Iceland per month by occupation and gender in 2022 (in 1,000 ISK)." Chart. May 5, 2023. Statista. Accessed May 06, 2025. https://www.statista.com/statistics/1260646/regular-earnings-in-iceland-by-occupation-and-gender/
Statistics Iceland. (2023). Average regular earnings in Iceland per month by occupation and gender in 2022 (in 1,000 ISK). Statista. Statista Inc.. Accessed: May 06, 2025. https://www.statista.com/statistics/1260646/regular-earnings-in-iceland-by-occupation-and-gender/
Statistics Iceland. "Average Regular Earnings in Iceland per Month by Occupation and Gender in 2022 (in 1,000 Isk)." Statista, Statista Inc., 5 May 2023, https://www.statista.com/statistics/1260646/regular-earnings-in-iceland-by-occupation-and-gender/
Statistics Iceland, Average regular earnings in Iceland per month by occupation and gender in 2022 (in 1,000 ISK) Statista, https://www.statista.com/statistics/1260646/regular-earnings-in-iceland-by-occupation-and-gender/ (last visited May 06, 2025)
Average regular earnings in Iceland per month by occupation and gender in 2022 (in 1,000 ISK) [Graph], Statistics Iceland, May 5, 2023. [Online]. Available: https://www.statista.com/statistics/1260646/regular-earnings-in-iceland-by-occupation-and-gender/
Profit from additional features with an Employee Account
Please create an employee account to be able to mark statistics as favorites.
Then you can access your favorite statistics via the star in the header.
Profit from the additional features of your individual account
Currently, you are using a shared account. To use individual functions (e.g., mark statistics as favourites, set
statistic alerts) please log in with your personal account.
If you are an admin, please authenticate by logging in again.