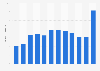
In Iceland, the average actual weekly working hours of men were constantly higher than those of women from 2010 to 2022. Whereas women worked an average of around 31.5 hours per week in 2022, men worked nearly 39 hours per week. The government in Iceland recently decided to reduce the standard working hours in the country from 40 to 36 or 35 hours per week.
Advertisement
Advertisement
Average actual weekly working hours in Iceland by gender from 2010 to 2022
Profit from the additional features of your individual account
Currently, you are using a shared account. To use individual functions (e.g., mark statistics as favourites, set
statistic alerts) please log in with your personal account.
If you are an admin, please authenticate by logging in again.
Learn more about how Statista can support your business.
Statistics Iceland. (March 2, 2023). Average actual weekly working hours in Iceland by gender from 2010 to 2022 [Graph]. In Statista. Retrieved July 13, 2025, from https://www.statista.com/statistics/1260801/average-weekly-working-hours-in-iceland-by-gender/
Statistics Iceland. "Average actual weekly working hours in Iceland by gender from 2010 to 2022." Chart. March 2, 2023. Statista. Accessed July 13, 2025. https://www.statista.com/statistics/1260801/average-weekly-working-hours-in-iceland-by-gender/
Statistics Iceland. (2023). Average actual weekly working hours in Iceland by gender from 2010 to 2022. Statista. Statista Inc.. Accessed: July 13, 2025. https://www.statista.com/statistics/1260801/average-weekly-working-hours-in-iceland-by-gender/
Statistics Iceland. "Average Actual Weekly Working Hours in Iceland by Gender from 2010 to 2022." Statista, Statista Inc., 2 Mar 2023, https://www.statista.com/statistics/1260801/average-weekly-working-hours-in-iceland-by-gender/
Statistics Iceland, Average actual weekly working hours in Iceland by gender from 2010 to 2022 Statista, https://www.statista.com/statistics/1260801/average-weekly-working-hours-in-iceland-by-gender/ (last visited July 13, 2025)
Average actual weekly working hours in Iceland by gender from 2010 to 2022 [Graph], Statistics Iceland, March 2, 2023. [Online]. Available: https://www.statista.com/statistics/1260801/average-weekly-working-hours-in-iceland-by-gender/