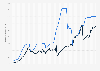
Ethereum's annualized footprint in electricity consumption declined substantially in the wake of Ethereum Merge in September 2022. Originally, the energy required to mine Ethereum in 2021 exceeding the consumption of countries like Colombia or Czechia - but the move away from proof of work (mining) to proof of stake (staking) changed things substantially. This according to a source that tries to estimate the energy consumption of Ethereum (ETH). It does by assuming that miner costs and income are the same thing: The higher the miner income, the more powerful machinery it can support. Essentially, the source first calculated how much miners earn, then estimated how much of this income is spent on electricity and how much per kWH, to finally be converted into consumption figures. The main reason this figure is an estimate, is due to the decentralized nature of Ethereum or cryptocurrencies in general: There is no central authority that tracks how many computers there are or where miners submit figures. Ethereum energy consumption is of importance for developments regarding NFTs and other applications of decentralized finance or DeFi - as the market share of the Ethereum blockchain in DeFi far exceeds that of other blockchains.
Advertisement
Advertisement
Ethereum energy consumption worldwide from May 2017 to March 20, 2025
(in terawatt hours)
Characteristic
Estimated TWh per year
Minimum TWh per year
Mar 20, 2025
0.01
0
Mar 19, 2025
0
0
Mar 18, 2025
0
0
Mar 17, 2025
0
0
Mar 16, 2025
0
0
Mar 15, 2025
0
0
Mar 14, 2025
0
0
Mar 13, 2025
0
0
Mar 12, 2025
0
0
Mar 11, 2025
0
0
Mar 10, 2025
0.01
0
Mar 09, 2025
0
0
Mar 08, 2025
0
0
Mar 07, 2025
0
0
Mar 06, 2025
0
0
Mar 05, 2025
0
0
Mar 04, 2025
0.01
0
Mar 03, 2025
0
0
Mar 02, 2025
0
0
Mar 01, 2025
0
0
Feb 2025
0
0
Jan 2025
0.01
0
Dec 2024
0.01
0
Nov 2024
0
0
Oct 2024
0
0
Sep 2024
0
0
Aug 2024
0
0
Jul 2024
0
0
Jun 2024
0
0
May 2024
0.01
0
Apr 2024
0
0
Mar 2024
0.01
0
Feb 2024
0.01
0
Jan 2024
0
0
Dec 2023
0.01
0
Nov 2023
0.01
0
Oct 2023
0.01
0
Sep 2023
0.01
0
Aug 2023
0.02
0
Jul 2023
0.01
0
Jun 2023
0.01
0
May 2023
0.01
0
Apr 2023
0.01
0
Mar 2023
0.02
0
Feb 2023
0.01
0
Jan 2023
0.01
0
Dec 2022
0.01
0
Nov 2022
0.01
0
Oct 2022
0.01
0
Sep 2022
0.01
0
Aug 2022
78.4
15.34
Jul 2022
86.35
15.71
Jun 2022
47.31
14.1
May 2022
93.97
17.84
Apr 2022
93.98
18.33
Mar 2022
92.12
17.44
Feb 2022
89.27
17.09
Jan 2022
86.62
16.94
Dec 2021
81.73
15.84
Nov 2021
73.21
14.2
Oct 2021
63.76
13.58
Sep 2021
55.18
12.24
Aug 2021
47.99
11.38
Jul 2021
41.26
0
Jun 2021
36.63
8.33
May 2021
31.57
10.28
Apr 2021
24.2
9.92
Mar 2021
19.03
8.3
Feb 2021
15.08
7.14
Jan 2021
11.77
5.87
Dec 2020
9.13
5.02
Nov 2020
7.84
4.93
Oct 2020
7.05
4.5
Sep 2020
6.56
4.29
Aug 2020
6.44
3.41
Jul 2020
7.12
2.97
Jun 2020
8.25
2.93
May 2020
9.49
2.89
Apr 2020
10.29
2.83
Mar 2020
6.65
2.75
Feb 2020
10.93
2.88
Jan 2020
8.95
2.57
Dec 2019
4.88
2.4
Nov 2019
6.68
2.75
Oct 2019
8.71
2.95
Sep 2019
8.83
3.03
Aug 2019
8.57
2.78
Jul 2019
10.83
2.78
Jun 2019
14.52
2.72
May 2019
13.27
2.61
Apr 2019
7.98
2.39
Mar 2019
7.02
2.16
Feb 2019
6.58
2.47
Jan 2019
6.07
2.77
Dec 2018
9.09
4.03
Nov 2018
8.13
5.08
Oct 2018
14.62
7.94
Sep 2018
17.32
9.67
Aug 2018
21.04
11.67
Jul 2018
24.41
12.55
Jun 2018
23.76
12.72
May 2018
23.31
11.91
Apr 2018
22.36
12.82
Mar 2018
22.36
13.95
Feb 2018
21.69
14.24
Jan 2018
19.81
12.84
Dec 2017
16.33
9.56
Nov 2017
16.33
8.88
Oct 2017
16.33
8.39
Sep 2017
16.33
4.64
Aug 2017
16.33
4.98
Jul 2017
16.33
4.89
Jun 2017
16.33
4.41
May 2017
11.07
2.62
Zoomable Statistic: Select the range in the chart you want to zoom in on.
Profit from the additional features of your individual account
Currently, you are using a shared account. To use individual functions (e.g., mark statistics as favourites, set
statistic alerts) please log in with your personal account.
If you are an admin, please authenticate by logging in again.
Learn more about how Statista can support your business.
Digiconomist. (March 21, 2025). Ethereum energy consumption worldwide from May 2017 to March 20, 2025 (in terawatt hours) [Graph]. In Statista. Retrieved July 11, 2025, from https://www.statista.com/statistics/1265897/worldwide-ethereum-energy-consumption/
Digiconomist. "Ethereum energy consumption worldwide from May 2017 to March 20, 2025 (in terawatt hours)." Chart. March 21, 2025. Statista. Accessed July 11, 2025. https://www.statista.com/statistics/1265897/worldwide-ethereum-energy-consumption/
Digiconomist. (2025). Ethereum energy consumption worldwide from May 2017 to March 20, 2025 (in terawatt hours). Statista. Statista Inc.. Accessed: July 11, 2025. https://www.statista.com/statistics/1265897/worldwide-ethereum-energy-consumption/
Digiconomist. "Ethereum Energy Consumption Worldwide from May 2017 to March 20, 2025 (in Terawatt Hours)." Statista, Statista Inc., 21 Mar 2025, https://www.statista.com/statistics/1265897/worldwide-ethereum-energy-consumption/
Digiconomist, Ethereum energy consumption worldwide from May 2017 to March 20, 2025 (in terawatt hours) Statista, https://www.statista.com/statistics/1265897/worldwide-ethereum-energy-consumption/ (last visited July 11, 2025)
Ethereum energy consumption worldwide from May 2017 to March 20, 2025 (in terawatt hours) [Graph], Digiconomist, March 21, 2025. [Online]. Available: https://www.statista.com/statistics/1265897/worldwide-ethereum-energy-consumption/