An analysis on how environmental, social and governance (ESG) scores are correlated with share market returns of companies worldwide between 2009 and 2019 shows a broad trend that:
companies with ****** ESG scores generate ***** returns than the average; while
companies with ***** ESG scores generate ****** returns than the average.
However, while all ESG score providers showed a relationship between lower scores and higher returns, there was considerable difference when it came to the inverse. Data for one provider suggested that ****** ESG scores on that framework generated ****** returns than companies with a ****ESG score, while another two providers showed basically****difference between high ESG scores and average returns. In other words, the difference between ESG scoring frameworks seems to have more of an effect on returns than whether the score itself is high.
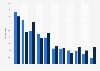
Differences in return on investments in companies worldwide between 2009 and 2019, by environmental, social and governance (ESG) score band and ESG framework provider
(in percentage points)
* Alpha for the top quintile of providers four and five rounds to zero, but in the case of provider four it is slightly below zero and in the case of provider five slightly above zero.
** Alpha refers to the difference between the return on an investment and some kind of benchmark - in this case overall returns without factoring in ESG scores.
The source does not name the ESG framework providers.
Profit from the additional features of your individual account
Currently, you are using a shared account. To use individual functions (e.g., mark statistics as favourites, set
statistic alerts) please log in with your personal account.
If you are an admin, please authenticate by logging in again.
Learn more about how Statista can support your business.
Statista. (September 29, 2021). Differences in return on investments in companies worldwide between 2009 and 2019, by environmental, social and governance (ESG) score band and ESG framework provider (in percentage points) [Graph]. In Statista. Retrieved July 13, 2025, from https://www.statista.com/statistics/1268405/return-differential-esg-score-provider-worldwide/
Statista. "Differences in return on investments in companies worldwide between 2009 and 2019, by environmental, social and governance (ESG) score band and ESG framework provider (in percentage points)." Chart. September 29, 2021. Statista. Accessed July 13, 2025. https://www.statista.com/statistics/1268405/return-differential-esg-score-provider-worldwide/
Statista. (2021). Differences in return on investments in companies worldwide between 2009 and 2019, by environmental, social and governance (ESG) score band and ESG framework provider (in percentage points). Statista. Statista Inc.. Accessed: July 13, 2025. https://www.statista.com/statistics/1268405/return-differential-esg-score-provider-worldwide/
Statista. "Differences in Return on Investments in Companies Worldwide between 2009 and 2019, by Environmental, Social and Governance (Esg) Score Band and Esg Framework Provider (in Percentage Points)." Statista, Statista Inc., 29 Sep 2021, https://www.statista.com/statistics/1268405/return-differential-esg-score-provider-worldwide/
Statista, Differences in return on investments in companies worldwide between 2009 and 2019, by environmental, social and governance (ESG) score band and ESG framework provider (in percentage points) Statista, https://www.statista.com/statistics/1268405/return-differential-esg-score-provider-worldwide/ (last visited July 13, 2025)
Differences in return on investments in companies worldwide between 2009 and 2019, by environmental, social and governance (ESG) score band and ESG framework provider (in percentage points) [Graph], Statista, September 29, 2021. [Online]. Available: https://www.statista.com/statistics/1268405/return-differential-esg-score-provider-worldwide/