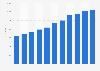
From 2011 to 2022, Sweden had the highest gross domestic product (GDP) of the Nordic countries. In 2022, it was estimated to be at 591 billion U.S. dollars, and is expected to reach almost 720 billion in 2027. Norway had the second highest GDP in this time period, but it dropped significantly after the fall in the oil price in 2014. Denmark has consistently been the third largest Nordic economy in this time. Iceland has the lowest GDP in the region, with just 28 billion U.S. dollars in 2022; around 10 percent the size of Finland's.
Advertisement
Advertisement
Gross domestic product (GDP) at current prices in the Nordic countries from 2011 to 2027, by country
(in billion U.S. dollars)
Characteristic
Denmark
Finland
Iceland
Norway
Sweden
2011
344
275.56
15.22
501.36
574.09
2012
327.15
258.45
14.75
512.78
552.48
2013
343.58
271.37
16.13
526.01
586.84
2014
352.99
274.93
17.87
501.74
581.96
2015
302.67
234.56
17.52
388.16
505.1
2016
313.12
240.71
20.79
370.96
515.66
2017
332.12
255.56
24.73
401.75
541.02
2018
356.84
275.83
26.26
439.79
555.46
2019
346.5
268.55
24.68
408.74
533.88
2020
354.76
271.67
21.57
367.63
547.05
2021
405.69
296.97
25.6
490.29
639.72
2022
401.13
283.12
28.07
579.42
591.19
2023*
420.8
305.69
30.57
546.77
597.11
Zoomable Statistic: Select the range in the chart you want to zoom in on.
0200400600800
Add this content to your personal favorites. These can be accessed from the favorites menu in the main navigation.
You have no right to use this feature.
Make sure to contact us if you are interested in scientific citation.
You can upgrade your account to enable this functionality for all statistics.
This feature is not available with your current account.Request access
Learn more about how Statista can support your business.
IMF. (October 10, 2023). Gross domestic product (GDP) at current prices in the Nordic countries from 2011 to 2027, by country (in billion U.S. dollars) [Graph]. In Statista. Retrieved July 26, 2025, from https://www.statista.com/statistics/1274423/gdp-current-prices-nordic-countries/
IMF. "Gross domestic product (GDP) at current prices in the Nordic countries from 2011 to 2027, by country (in billion U.S. dollars)." Chart. October 10, 2023. Statista. Accessed July 26, 2025. https://www.statista.com/statistics/1274423/gdp-current-prices-nordic-countries/
IMF. (2023). Gross domestic product (GDP) at current prices in the Nordic countries from 2011 to 2027, by country (in billion U.S. dollars). Statista. Statista Inc.. Accessed: July 26, 2025. https://www.statista.com/statistics/1274423/gdp-current-prices-nordic-countries/
IMF. "Gross Domestic Product (Gdp) at Current Prices in The Nordic Countries from 2011 to 2027, by Country (in Billion U.S. Dollars)." Statista, Statista Inc., 10 Oct 2023, https://www.statista.com/statistics/1274423/gdp-current-prices-nordic-countries/
IMF, Gross domestic product (GDP) at current prices in the Nordic countries from 2011 to 2027, by country (in billion U.S. dollars) Statista, https://www.statista.com/statistics/1274423/gdp-current-prices-nordic-countries/ (last visited July 26, 2025)
Gross domestic product (GDP) at current prices in the Nordic countries from 2011 to 2027, by country (in billion U.S. dollars) [Graph], IMF, October 10, 2023. [Online]. Available: https://www.statista.com/statistics/1274423/gdp-current-prices-nordic-countries/
Advertisement
Profit from additional features with an Employee Account
Please create an employee account to be able to mark statistics as favorites.
Then you can access your favorite statistics via the star in the header.
Profit from the additional features of your individual account
Currently, you are using a shared account. To use individual functions (e.g., mark statistics as favourites, set
statistic alerts) please log in with your personal account.
If you are an admin, please authenticate by logging in again.