Solana processed nearly 500 million coin transfers in a single month by late 2021, an increase from figures during the summer. A transfer consist of a native coin or token getting moved on its blockchain, and the source does not immediately clarify whether this equals a metric called "transaction volume" or not. A historical time series on network activity for Solana specifically has been difficult to track due to the network's speed: It is meant to process many more transactions than its competitors Ethereum or Binance Smart Chain. Some dashboards list the network's total transaction count - as of December 7 - on roughly 43.7 billion, since April 2020.
Advertisement
Advertisement
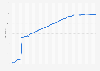
Number of Solana (SOL) transfers per day on the blockchain from January 2021 to November 2021
(in 1,000s)
Adjust the presentation of the statistic and data points.
Share the statistic on social media channels or embed the statistic in your
website using "Embed Code", where available.
Cite this statistic and select one of the following formats: APA, Chicago, Harvard, MLA & Bluebook.
Print the statistic including description and metadata.
Chart type
Number of Solana (SOL) transfers per day on the blockchain from January 2021 to November 2021
Share this statistic
You have no right to use this feature.
Make sure to contact us if you are interested in scientific citation.
You can upgrade your account to enable this functionality for all statistics.
This feature is not available with your current account.Request access
The source adds "A transfer is when a native coin or the token gets transferred on the blockchain. A transaction can contain zero or multiple transfers."
Learn more about how Statista can support your business.
Bitquery. (December 7, 2021). Number of Solana (SOL) transfers per day on the blockchain from January 2021 to November 2021 (in 1,000s) [Graph]. In Statista. Retrieved June 27, 2025, from https://www.statista.com/statistics/1280088/average-number-of-solana-transfers/
Bitquery. "Number of Solana (SOL) transfers per day on the blockchain from January 2021 to November 2021 (in 1,000s)." Chart. December 7, 2021. Statista. Accessed June 27, 2025. https://www.statista.com/statistics/1280088/average-number-of-solana-transfers/
Bitquery. (2021). Number of Solana (SOL) transfers per day on the blockchain from January 2021 to November 2021 (in 1,000s). Statista. Statista Inc.. Accessed: June 27, 2025. https://www.statista.com/statistics/1280088/average-number-of-solana-transfers/
Bitquery. "Number of Solana (Sol) Transfers per Day on The Blockchain from January 2021 to November 2021 (in 1,000s)." Statista, Statista Inc., 7 Dec 2021, https://www.statista.com/statistics/1280088/average-number-of-solana-transfers/
Bitquery, Number of Solana (SOL) transfers per day on the blockchain from January 2021 to November 2021 (in 1,000s) Statista, https://www.statista.com/statistics/1280088/average-number-of-solana-transfers/ (last visited June 27, 2025)
Number of Solana (SOL) transfers per day on the blockchain from January 2021 to November 2021 (in 1,000s) [Graph], Bitquery, December 7, 2021. [Online]. Available: https://www.statista.com/statistics/1280088/average-number-of-solana-transfers/
Advertisement
Profit from additional features with an Employee Account
Please create an employee account to be able to mark statistics as favorites.
Then you can access your favorite statistics via the star in the header.
Profit from the additional features of your individual account
Currently, you are using a shared account. To use individual functions (e.g., mark statistics as favourites, set
statistic alerts) please log in with your personal account.
If you are an admin, please authenticate by logging in again.