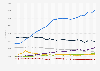
In 2023, global greenhouse gas (GHG) emissions increased by *** percent year-over-year to reach a new record high of ** billion metric tons of carbon dioxide equivalent (GtCO₂e). This represents a more than ** percent rise in GHG emissions since 1990. The continuous growth in emissions has significant implications for global climate patterns and environmental stability.
Rising global temperatures
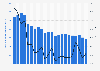
GHG emissions from human activities are contributing to global warming. In 2023, the global land and ocean surface temperature stood at **** degrees Celsius above the 20th century average, the largest recorded deviation in history. This temperature increase is part of a consistent pattern of positive temperature anomalies observed since the 1980s, highlighting the long-term warming effect of increased GHG accumulation in the atmosphere, particularly carbon dioxide.
Biggest contributors to GHG emissions
Globally, the power industry was responsible for ** GtCO₂e in 2023, accounting for approximately ** percent of global GHG emissions. This sector's emissions were nearly double those of the global transportation sector, the second-largest emitter. Coal-fired generation is the main contributor to power sector emissions. This is particularly the case in Asian countries, where there is a high reliance on this energy source. The Asia-Pacific region was the largest contributor to global CO₂ emissions in 2023, producing **** GtCO₂ from energy use alone.
Profit from the additional features of your individual account
Currently, you are using a shared account. To use individual functions (e.g., mark statistics as favourites, set
statistic alerts) please log in with your personal account.
If you are an admin, please authenticate by logging in again.
Learn more about how Statista can support your business.
EDGAR/JRC. (September 5, 2024). Annual greenhouse gas emissions worldwide from 1970 to 2023 (in billion metric tons of CO₂ equivalent) [Graph]. In Statista. Retrieved June 30, 2025, from https://www.statista.com/statistics/1285502/annual-global-greenhouse-gas-emissions/
EDGAR/JRC. "Annual greenhouse gas emissions worldwide from 1970 to 2023 (in billion metric tons of CO₂ equivalent)." Chart. September 5, 2024. Statista. Accessed June 30, 2025. https://www.statista.com/statistics/1285502/annual-global-greenhouse-gas-emissions/
EDGAR/JRC. (2024). Annual greenhouse gas emissions worldwide from 1970 to 2023 (in billion metric tons of CO₂ equivalent). Statista. Statista Inc.. Accessed: June 30, 2025. https://www.statista.com/statistics/1285502/annual-global-greenhouse-gas-emissions/
EDGAR/JRC. "Annual Greenhouse Gas Emissions Worldwide from 1970 to 2023 (in Billion Metric Tons of Co₂ Equivalent)." Statista, Statista Inc., 5 Sep 2024, https://www.statista.com/statistics/1285502/annual-global-greenhouse-gas-emissions/
EDGAR/JRC, Annual greenhouse gas emissions worldwide from 1970 to 2023 (in billion metric tons of CO₂ equivalent) Statista, https://www.statista.com/statistics/1285502/annual-global-greenhouse-gas-emissions/ (last visited June 30, 2025)
Annual greenhouse gas emissions worldwide from 1970 to 2023 (in billion metric tons of CO₂ equivalent) [Graph], EDGAR/JRC, September 5, 2024. [Online]. Available: https://www.statista.com/statistics/1285502/annual-global-greenhouse-gas-emissions/