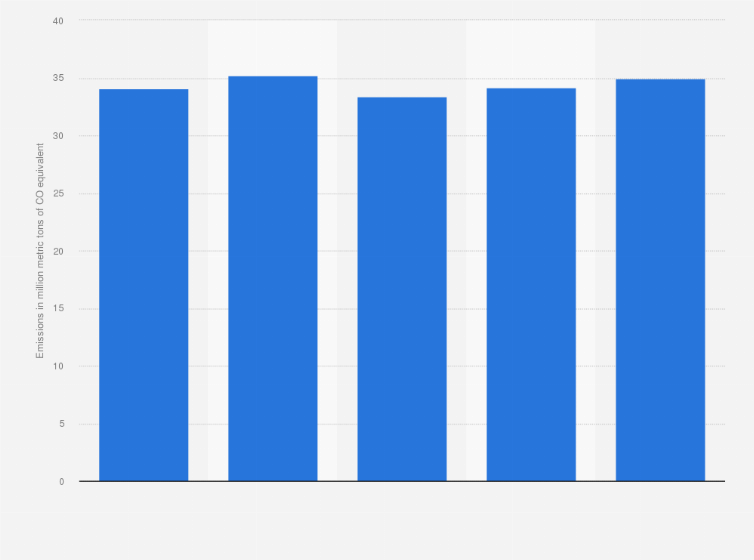
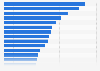
In 2022, Suncor's total greenhouse gas (GHG) emissions stood at nearly 35 million metric tons of carbon dioxide equivalent (MtCO₂e), an increase of 2.4 percent in comparison to the previous year. The majority of Suncor's emissions are attributable to the company's oil sands operations.
Greenhouse gas emissions of Suncor from 2018 to 2022
(in million metric tons of CO₂ equivalent)
Characteristic
Emissions in million metric tons of CO₂ equivalent
Adjust the presentation of the statistic and data points.
Share the statistic on social media channels or embed the statistic in your
website using "Embed Code", where available.
Cite this statistic and select one of the following formats: APA, Chicago, Harvard, MLA & Bluebook.
Print the statistic including description and metadata.
Chart type
Greenhouse gas emissions of Suncor from 2018 to 2022
Share this statistic
You have no right to use this feature.
Make sure to contact us if you are interested in scientific citation.
You can upgrade your account to enable this functionality for all statistics.
This feature is not available with your current account.Request access
Learn more about how Statista can support your business.
Suncor. (September 22, 2023). Greenhouse gas emissions of Suncor from 2018 to 2022 (in million metric tons of CO₂ equivalent) [Graph]. In Statista. Retrieved May 13, 2025, from https://www.statista.com/statistics/1290473/suncor-greenhouse-gas-emissions/
Suncor. "Greenhouse gas emissions of Suncor from 2018 to 2022 (in million metric tons of CO₂ equivalent)." Chart. September 22, 2023. Statista. Accessed May 13, 2025. https://www.statista.com/statistics/1290473/suncor-greenhouse-gas-emissions/
Suncor. (2023). Greenhouse gas emissions of Suncor from 2018 to 2022 (in million metric tons of CO₂ equivalent). Statista. Statista Inc.. Accessed: May 13, 2025. https://www.statista.com/statistics/1290473/suncor-greenhouse-gas-emissions/
Suncor. "Greenhouse Gas Emissions of Suncor from 2018 to 2022 (in Million Metric Tons of Co₂ Equivalent)." Statista, Statista Inc., 22 Sep 2023, https://www.statista.com/statistics/1290473/suncor-greenhouse-gas-emissions/
Suncor, Greenhouse gas emissions of Suncor from 2018 to 2022 (in million metric tons of CO₂ equivalent) Statista, https://www.statista.com/statistics/1290473/suncor-greenhouse-gas-emissions/ (last visited May 13, 2025)
Greenhouse gas emissions of Suncor from 2018 to 2022 (in million metric tons of CO₂ equivalent) [Graph], Suncor, September 22, 2023. [Online]. Available: https://www.statista.com/statistics/1290473/suncor-greenhouse-gas-emissions/
Profit from additional features with an Employee Account
Please create an employee account to be able to mark statistics as favorites.
Then you can access your favorite statistics via the star in the header.
Profit from the additional features of your individual account
Currently, you are using a shared account. To use individual functions (e.g., mark statistics as favourites, set
statistic alerts) please log in with your personal account.
If you are an admin, please authenticate by logging in again.