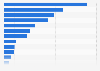
At the beginning of 2022, container ships on the Asia - North America shipping route had a combined capacity of about 5.45 million TEUs. This represents an increase of some 31 percent compared with the beginning of 2021.
Advertisement
Advertisement
Deployment of container ship capacity worldwide from January 2021 to January 2022, by trade route
(in million TEUs)
Profit from the additional features of your individual account
Currently, you are using a shared account. To use individual functions (e.g., mark statistics as favourites, set
statistic alerts) please log in with your personal account.
If you are an admin, please authenticate by logging in again.
Learn more about how Statista can support your business.
Statista. (February 14, 2022). Deployment of container ship capacity worldwide from January 2021 to January 2022, by trade route (in million TEUs) [Graph]. In Statista. Retrieved June 20, 2025, from https://www.statista.com/statistics/1290630/global-container-ship-teu-capacity-by-trade-route/
Statista. "Deployment of container ship capacity worldwide from January 2021 to January 2022, by trade route (in million TEUs)." Chart. February 14, 2022. Statista. Accessed June 20, 2025. https://www.statista.com/statistics/1290630/global-container-ship-teu-capacity-by-trade-route/
Statista. (2022). Deployment of container ship capacity worldwide from January 2021 to January 2022, by trade route (in million TEUs). Statista. Statista Inc.. Accessed: June 20, 2025. https://www.statista.com/statistics/1290630/global-container-ship-teu-capacity-by-trade-route/
Statista. "Deployment of Container Ship Capacity Worldwide from January 2021 to January 2022, by Trade Route (in Million Teus)." Statista, Statista Inc., 14 Feb 2022, https://www.statista.com/statistics/1290630/global-container-ship-teu-capacity-by-trade-route/
Statista, Deployment of container ship capacity worldwide from January 2021 to January 2022, by trade route (in million TEUs) Statista, https://www.statista.com/statistics/1290630/global-container-ship-teu-capacity-by-trade-route/ (last visited June 20, 2025)
Deployment of container ship capacity worldwide from January 2021 to January 2022, by trade route (in million TEUs) [Graph], Statista, February 14, 2022. [Online]. Available: https://www.statista.com/statistics/1290630/global-container-ship-teu-capacity-by-trade-route/