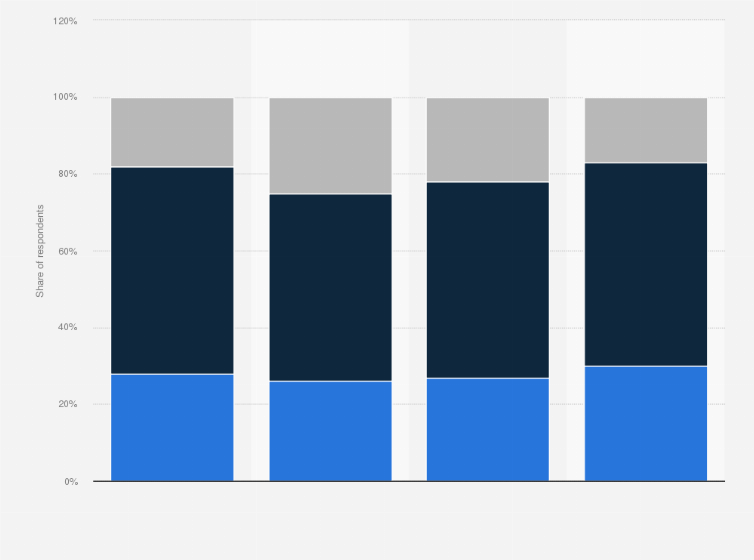
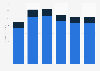
percent of adult gamers in the United States who played on smartphones or tablets were planning to increase their purchases of virtual and digital goods within the next year. Computer and web/browser gamers were the least likely to increase their purchases in the upcoming year, with only
**
Log in or register to access precise data.
and
**
Log in or register to access precise data.
percent of each group respectively stating that they intended to buy more virtual goods.
Adjust the presentation of the statistic and data points.
Share the statistic on social media channels or embed the statistic in your
website using "Embed Code", where available.
Cite this statistic and select one of the following formats: APA, Chicago, Harvard, MLA & Bluebook.
Print the statistic including description and metadata.
Chart type
Planned purchase volume of virtual or digital goods among gaming spenders in the United States as of March 2024, by platform
Share this statistic
You have no right to use this feature.
Make sure to contact us if you are interested in scientific citation.
You can upgrade your account to enable this functionality for all statistics.
This feature is not available with your current account.Request access
among those who make purchases in games on each platform
Method of interview
Online survey
Supplementary notes
Original question: Do you intend to buy more, less, or the same amount of virtual/digital goods in the following types of games in the next year? (Among those who make purchases on each platform; Computer N=871; Mobile N=910; Console N=929; Web games N=840)
Learn more about how Statista can support your business.
Vorhaus Advisors. (May 15, 2024). Planned purchase volume of virtual or digital goods among gaming spenders in the United States as of March 2024, by platform [Graph]. In Statista. Retrieved July 05, 2025, from https://www.statista.com/statistics/1295363/us-planned-virtual-gaming-goods-purchases-increase-by-platform/
Vorhaus Advisors. "Planned purchase volume of virtual or digital goods among gaming spenders in the United States as of March 2024, by platform." Chart. May 15, 2024. Statista. Accessed July 05, 2025. https://www.statista.com/statistics/1295363/us-planned-virtual-gaming-goods-purchases-increase-by-platform/
Vorhaus Advisors. (2024). Planned purchase volume of virtual or digital goods among gaming spenders in the United States as of March 2024, by platform. Statista. Statista Inc.. Accessed: July 05, 2025. https://www.statista.com/statistics/1295363/us-planned-virtual-gaming-goods-purchases-increase-by-platform/
Vorhaus Advisors. "Planned Purchase Volume of Virtual or Digital Goods among Gaming Spenders in The United States as of March 2024, by Platform." Statista, Statista Inc., 15 May 2024, https://www.statista.com/statistics/1295363/us-planned-virtual-gaming-goods-purchases-increase-by-platform/
Vorhaus Advisors, Planned purchase volume of virtual or digital goods among gaming spenders in the United States as of March 2024, by platform Statista, https://www.statista.com/statistics/1295363/us-planned-virtual-gaming-goods-purchases-increase-by-platform/ (last visited July 05, 2025)
Planned purchase volume of virtual or digital goods among gaming spenders in the United States as of March 2024, by platform [Graph], Vorhaus Advisors, May 15, 2024. [Online]. Available: https://www.statista.com/statistics/1295363/us-planned-virtual-gaming-goods-purchases-increase-by-platform/
Advertisement
Profit from additional features with an Employee Account
Please create an employee account to be able to mark statistics as favorites.
Then you can access your favorite statistics via the star in the header.
Profit from the additional features of your individual account
Currently, you are using a shared account. To use individual functions (e.g., mark statistics as favourites, set
statistic alerts) please log in with your personal account.
If you are an admin, please authenticate by logging in again.