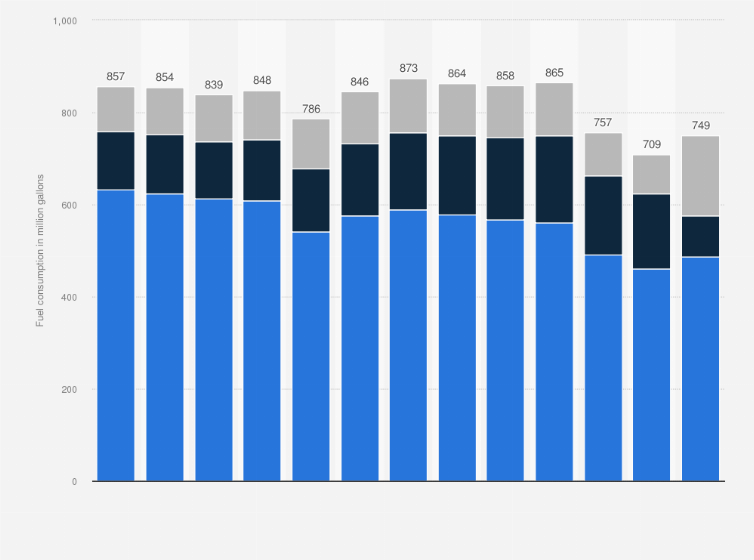
In 2022, the amount of motor fuel consumed by the transit networks in the United States reached 749 million gallons, a year-over-year increase of around 5.6 percent from the previous year. During the same year, the most consumed fuel type was diesel, with almost 65 percent of the total fuel consumption.
Advertisement
Advertisement
Motor fuel consumption of transit in the United States from 2010 to 2022, by type
(in million gallons)
Adjust the presentation of the statistic and data points.
Share the statistic on social media channels or embed the statistic in your
website using "Embed Code", where available.
Cite this statistic and select one of the following formats: APA, Chicago, Harvard, MLA & Bluebook.
Print the statistic including description and metadata.
Chart type
Motor fuel consumption of transit in the United States from 2010 to 2022, by type
Share this statistic
You have no right to use this feature.
Make sure to contact us if you are interested in scientific citation.
You can upgrade your account to enable this functionality for all statistics.
This feature is not available with your current account.Request access
* Includes diesel and bio-diesel.
** Includes gasoline, Liquified Petroleum Gas, Liquified Natural Gas, methane, ethanol, bunker fuel, kerosene, grain additive, and other fuels.
Learn more about how Statista can support your business.
Bureau of Transportation Statistics. (December 27, 2023). Motor fuel consumption of transit in the United States from 2010 to 2022, by type (in million gallons) [Graph]. In Statista. Retrieved June 17, 2025, from https://www.statista.com/statistics/1296155/fuel-consumption-of-us-transit-traffic-by-type/
Bureau of Transportation Statistics. "Motor fuel consumption of transit in the United States from 2010 to 2022, by type (in million gallons)." Chart. December 27, 2023. Statista. Accessed June 17, 2025. https://www.statista.com/statistics/1296155/fuel-consumption-of-us-transit-traffic-by-type/
Bureau of Transportation Statistics. (2023). Motor fuel consumption of transit in the United States from 2010 to 2022, by type (in million gallons). Statista. Statista Inc.. Accessed: June 17, 2025. https://www.statista.com/statistics/1296155/fuel-consumption-of-us-transit-traffic-by-type/
Bureau of Transportation Statistics. "Motor Fuel Consumption of Transit in The United States from 2010 to 2022, by Type (in Million Gallons)." Statista, Statista Inc., 27 Dec 2023, https://www.statista.com/statistics/1296155/fuel-consumption-of-us-transit-traffic-by-type/
Bureau of Transportation Statistics, Motor fuel consumption of transit in the United States from 2010 to 2022, by type (in million gallons) Statista, https://www.statista.com/statistics/1296155/fuel-consumption-of-us-transit-traffic-by-type/ (last visited June 17, 2025)
Motor fuel consumption of transit in the United States from 2010 to 2022, by type (in million gallons) [Graph], Bureau of Transportation Statistics, December 27, 2023. [Online]. Available: https://www.statista.com/statistics/1296155/fuel-consumption-of-us-transit-traffic-by-type/
Advertisement
Profit from additional features with an Employee Account
Please create an employee account to be able to mark statistics as favorites.
Then you can access your favorite statistics via the star in the header.
Profit from the additional features of your individual account
Currently, you are using a shared account. To use individual functions (e.g., mark statistics as favourites, set
statistic alerts) please log in with your personal account.
If you are an admin, please authenticate by logging in again.