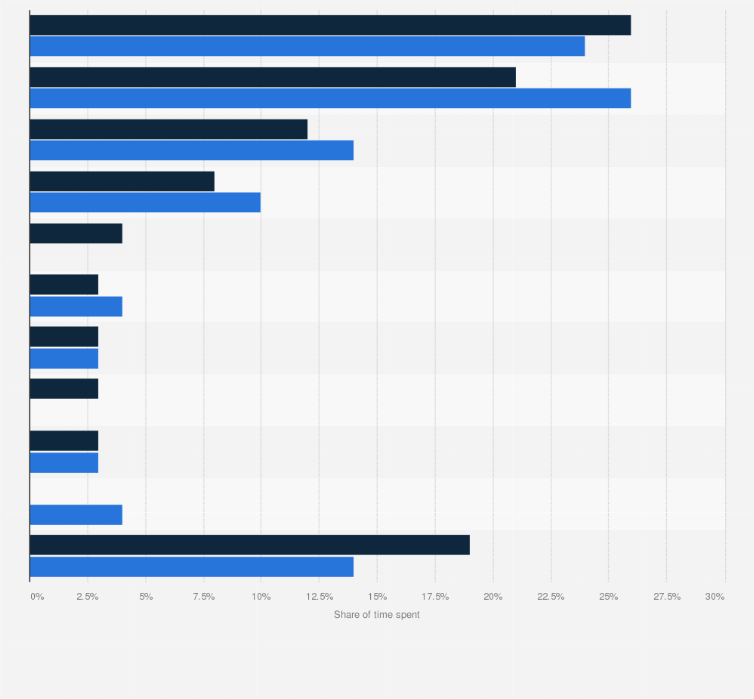
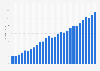
In May 2023, YouTube, Netflix, and Hulu occupied the vast majority of U.S. streaming video viewership time, with YouTube viewing making up 26 percent of total connected TV viewing hours. Amazon Prime Video accounted for eight percent of CTV viewership time in the U.S.
Distribution of total connected TV viewing hours in the United States in May 2022 and May 2023, by streaming service
Adjust the presentation of the statistic and data points.
Share the statistic on social media channels or embed the statistic in your
website using "Embed Code", where available.
Cite this statistic and select one of the following formats: APA, Chicago, Harvard, MLA & Bluebook.
Print the statistic including description and metadata.
Chart type
Distribution of total connected TV viewing hours in the United States in May 2022 and May 2023, by streaming service
Share this statistic
You have no right to use this feature.
Make sure to contact us if you are interested in scientific citation.
You can upgrade your account to enable this functionality for all statistics.
This feature is not available with your current account.Request access
Learn more about how Statista can support your business.
Next TV. (August 29, 2023). Distribution of total connected TV viewing hours in the United States in May 2022 and May 2023, by streaming service [Graph]. In Statista. Retrieved May 03, 2025, from https://www.statista.com/statistics/1300532/share-time-spent-streaming-video-us-by-app/
Next TV. "Distribution of total connected TV viewing hours in the United States in May 2022 and May 2023, by streaming service." Chart. August 29, 2023. Statista. Accessed May 03, 2025. https://www.statista.com/statistics/1300532/share-time-spent-streaming-video-us-by-app/
Next TV. (2023). Distribution of total connected TV viewing hours in the United States in May 2022 and May 2023, by streaming service. Statista. Statista Inc.. Accessed: May 03, 2025. https://www.statista.com/statistics/1300532/share-time-spent-streaming-video-us-by-app/
Next TV. "Distribution of Total Connected Tv Viewing Hours in The United States in May 2022 and May 2023, by Streaming Service." Statista, Statista Inc., 29 Aug 2023, https://www.statista.com/statistics/1300532/share-time-spent-streaming-video-us-by-app/
Next TV, Distribution of total connected TV viewing hours in the United States in May 2022 and May 2023, by streaming service Statista, https://www.statista.com/statistics/1300532/share-time-spent-streaming-video-us-by-app/ (last visited May 03, 2025)
Distribution of total connected TV viewing hours in the United States in May 2022 and May 2023, by streaming service [Graph], Next TV, August 29, 2023. [Online]. Available: https://www.statista.com/statistics/1300532/share-time-spent-streaming-video-us-by-app/
Profit from additional features with an Employee Account
Please create an employee account to be able to mark statistics as favorites.
Then you can access your favorite statistics via the star in the header.
Profit from the additional features of your individual account
Currently, you are using a shared account. To use individual functions (e.g., mark statistics as favourites, set
statistic alerts) please log in with your personal account.
If you are an admin, please authenticate by logging in again.