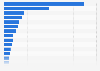
Africa exported liquefied natural gas to Spain worth nearly 2.8 billion U.S. dollars in 2021. The country was the main importer of African LNG that year, considering import value. To follow, France imported liquefied natural gas from Africa in the value of 2.1 billion U.S. dollars.
Advertisement
Advertisement
Export value of liquefied natural gas from Africa as of 2021, by country of destination
(in million U.S. dollars)
Profit from the additional features of your individual account
Currently, you are using a shared account. To use individual functions (e.g., mark statistics as favourites, set
statistic alerts) please log in with your personal account.
If you are an admin, please authenticate by logging in again.
Learn more about how Statista can support your business.
Trade Map. (April 5, 2022). Export value of liquefied natural gas from Africa as of 2021, by country of destination (in million U.S. dollars) [Graph]. In Statista. Retrieved June 26, 2025, from https://www.statista.com/statistics/1300680/export-value-of-liquefied-natural-gas-from-africa-by-country-of-destination/
Trade Map. "Export value of liquefied natural gas from Africa as of 2021, by country of destination (in million U.S. dollars)." Chart. April 5, 2022. Statista. Accessed June 26, 2025. https://www.statista.com/statistics/1300680/export-value-of-liquefied-natural-gas-from-africa-by-country-of-destination/
Trade Map. (2022). Export value of liquefied natural gas from Africa as of 2021, by country of destination (in million U.S. dollars). Statista. Statista Inc.. Accessed: June 26, 2025. https://www.statista.com/statistics/1300680/export-value-of-liquefied-natural-gas-from-africa-by-country-of-destination/
Trade Map. "Export Value of Liquefied Natural Gas from Africa as of 2021, by Country of Destination (in Million U.S. Dollars)." Statista, Statista Inc., 5 Apr 2022, https://www.statista.com/statistics/1300680/export-value-of-liquefied-natural-gas-from-africa-by-country-of-destination/
Trade Map, Export value of liquefied natural gas from Africa as of 2021, by country of destination (in million U.S. dollars) Statista, https://www.statista.com/statistics/1300680/export-value-of-liquefied-natural-gas-from-africa-by-country-of-destination/ (last visited June 26, 2025)
Export value of liquefied natural gas from Africa as of 2021, by country of destination (in million U.S. dollars) [Graph], Trade Map, April 5, 2022. [Online]. Available: https://www.statista.com/statistics/1300680/export-value-of-liquefied-natural-gas-from-africa-by-country-of-destination/