In 2024, consumer prices in South Korea increased by 2.3 percent compared to the previous year. Agricultural and marine products experienced the highest price increase at about 5.9 percent.
Advertisement
Advertisement
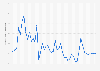
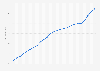
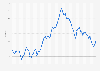
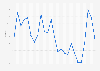
Annual Inflation rate for the Consumer Price Index (CPI) in South Korea from 1986 to 2024, by category
(compared to the previous year)
Characteristic
Agricultural and marine products
Industrial products
Rent
Public services
Personal services
2024
5.9%
1.5%
0.2%
1.7%
3%
2023
3.1%
2.6%
0.5%
1.3%
4.8%
2022
3.8%
6.9%
1.9%
0.8%
5.4%
2021
8.7%
2.3%
1.4%
1%
2.6%
2020
6.7%
-0.2%
0.2%
-1.9%
1.2%
2019
-1.7%
-0.2%
-0.1%
-0.5%
1.9%
2018
3.7%
1.3%
0.6%
0.2%
2.5%
2017
5.5%
1.4%
1.6%
1%
2.5%
2016
3.8%
-0.5%
1.9%
1.5%
2.7%
2015
2%
-0.2%
2.5%
1.2%
1.9%
2014
-2.7%
1.3%
2.3%
0.7%
1.7%
2013
-0.6%
0.9%
2.7%
0.7%
1.6%
2012
3.1%
2.8%
4.2%
0.5%
1.1%
2011
9.2%
4.9%
4%
-0.4%
3.7%
2010
10%
3.2%
1.9%
1.2%
2.2%
2009
6.4%
2.5%
1.6%
2%
2.8%
2008
0.5%
7.8%
2.3%
2.5%
4.7%
2007
1.9%
1.9%
1.8%
3.1%
3.1%
2006
-0.1%
2%
0.4%
3.5%
3%
2005
1.9%
3.7%
-0.2%
3.2%
3.2%
2004
8.9%
2.6%
1.6%
2.5%
4.1%
2003
5.9%
2.4%
3.6%
2.5%
4.5%
2002
6.2%
1.6%
5.7%
-1.3%
3.7%
2001
6.3%
2.6%
4.1%
7.4%
3.1%
2000
1.9%
1.6%
-0.4%
7.1%
2%
1999
7.3%
0.5%
-4.1%
2.2%
-1%
1998
6.1%
11.2%
0.5%
9.5%
5.3%
1997
3.8%
4.3%
3.3%
5.1%
5.3%
1996
1.8%
4.3%
3.5%
6.7%
7.6%
1995
2.9%
2.6%
3.8%
7.8%
7.9%
1994
12.2%
3.1%
3.9%
7.1%
7.9%
1993
1.6%
3.9%
5.8%
7.4%
7.7%
1992
4.1%
4.2%
7.6%
8.4%
10.5%
1991
13.2%
4.8%
11.7%
7%
16.4%
1990
11%
5.2%
10.5%
6%
14.5%
1989
6.9%
4.8%
6.6%
2.1%
11%
1988
13.4%
3%
5.4%
5.5%
9.2%
1987
3.5%
2.7%
3.1%
2.6%
4.3%
1986
1.9%
2%
4%
3.4%
5%
Zoomable Statistic: Select the range in the chart you want to zoom in on.
Profit from the additional features of your individual account
Currently, you are using a shared account. To use individual functions (e.g., mark statistics as favourites, set
statistic alerts) please log in with your personal account.
If you are an admin, please authenticate by logging in again.
Learn more about how Statista can support your business.
Statistics Korea. (January 2, 2025). Annual Inflation rate for the Consumer Price Index (CPI) in South Korea from 1986 to 2024, by category (compared to the previous year) [Graph]. In Statista. Retrieved June 20, 2025, from https://www.statista.com/statistics/1300960/south-korea-yoy-inflation-rate-by-item/
Statistics Korea. "Annual Inflation rate for the Consumer Price Index (CPI) in South Korea from 1986 to 2024, by category (compared to the previous year)." Chart. January 2, 2025. Statista. Accessed June 20, 2025. https://www.statista.com/statistics/1300960/south-korea-yoy-inflation-rate-by-item/
Statistics Korea. (2025). Annual Inflation rate for the Consumer Price Index (CPI) in South Korea from 1986 to 2024, by category (compared to the previous year). Statista. Statista Inc.. Accessed: June 20, 2025. https://www.statista.com/statistics/1300960/south-korea-yoy-inflation-rate-by-item/
Statistics Korea. "Annual Inflation Rate for The Consumer Price Index (Cpi) in South Korea from 1986 to 2024, by Category (Compared to The Previous Year)." Statista, Statista Inc., 2 Jan 2025, https://www.statista.com/statistics/1300960/south-korea-yoy-inflation-rate-by-item/
Statistics Korea, Annual Inflation rate for the Consumer Price Index (CPI) in South Korea from 1986 to 2024, by category (compared to the previous year) Statista, https://www.statista.com/statistics/1300960/south-korea-yoy-inflation-rate-by-item/ (last visited June 20, 2025)
Annual Inflation rate for the Consumer Price Index (CPI) in South Korea from 1986 to 2024, by category (compared to the previous year) [Graph], Statistics Korea, January 2, 2025. [Online]. Available: https://www.statista.com/statistics/1300960/south-korea-yoy-inflation-rate-by-item/