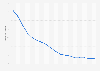
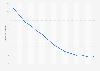
A major demographic difference between pre-industrial societies and today was the prevalence of infant mortality. In some periods, it is estimated that almost a third of babies born would not live to see their first birthday. In other periods, the absence of pandemics, and improvements in living standards saw lower rates of infant mortality. However, the introduction of vaccination, followed by other medical advances, was the most significant factor in reducing infant mortality, and kickstarting the demographic transition across the globe. Today, in the most developed countries, infant mortality is as low as 1.5 deaths per 1,000 births; compared to over 100 deaths per 1,000 births in Afghanistan.
Advertisement
Advertisement
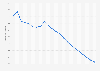
Average infant mortality (under one year) in selected regions and time periods from 33CE to 1875 CE
(per 1,000 live births)
Characteristic
Infant mortality, under one year (per 1,000 live births)
Roman Egypt 33-258
329
England 1301-1425
218
England 1620-1626
171
England 1726-1751
195
England 1801-1826
144
France 1740-1749
296
France 1820-1829
181
Sweden 1751-1755
203
Japan 1776-1875
277
Japan 1800-1850
295
Japan 1751-1869
216
0100200300255075125150175225250275325350375
Add this content to your personal favorites. These can be accessed from the favorites menu in the main navigation.
You have no right to use this feature.
Make sure to contact us if you are interested in scientific citation.
You can upgrade your account to enable this functionality for all statistics.
This feature is not available with your current account.Request access
Learn more about how Statista can support your business.
OECD. (December 31, 2006). Average infant mortality (under one year) in selected regions and time periods from 33CE to 1875 CE (per 1,000 live births) [Graph]. In Statista. Retrieved July 04, 2025, from https://www.statista.com/statistics/1302713/infant-mortality-historical-areas/
OECD. "Average infant mortality (under one year) in selected regions and time periods from 33CE to 1875 CE (per 1,000 live births)." Chart. December 31, 2006. Statista. Accessed July 04, 2025. https://www.statista.com/statistics/1302713/infant-mortality-historical-areas/
OECD. (2006). Average infant mortality (under one year) in selected regions and time periods from 33CE to 1875 CE (per 1,000 live births). Statista. Statista Inc.. Accessed: July 04, 2025. https://www.statista.com/statistics/1302713/infant-mortality-historical-areas/
OECD. "Average Infant Mortality (under One Year) in Selected Regions and Time Periods from 33ce to 1875 Ce (per 1,000 Live Births)." Statista, Statista Inc., 31 Dec 2006, https://www.statista.com/statistics/1302713/infant-mortality-historical-areas/
OECD, Average infant mortality (under one year) in selected regions and time periods from 33CE to 1875 CE (per 1,000 live births) Statista, https://www.statista.com/statistics/1302713/infant-mortality-historical-areas/ (last visited July 04, 2025)
Average infant mortality (under one year) in selected regions and time periods from 33CE to 1875 CE (per 1,000 live births) [Graph], OECD, December 31, 2006. [Online]. Available: https://www.statista.com/statistics/1302713/infant-mortality-historical-areas/
Advertisement
Profit from additional features with an Employee Account
Please create an employee account to be able to mark statistics as favorites.
Then you can access your favorite statistics via the star in the header.
Profit from the additional features of your individual account
Currently, you are using a shared account. To use individual functions (e.g., mark statistics as favourites, set
statistic alerts) please log in with your personal account.
If you are an admin, please authenticate by logging in again.