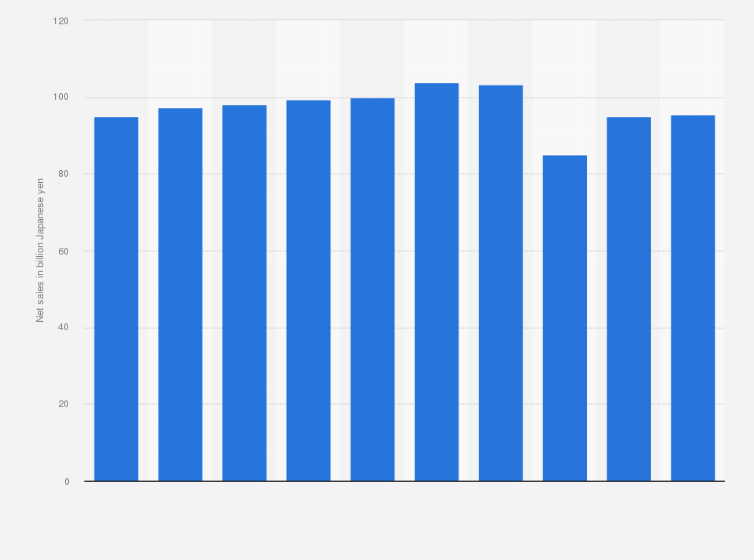
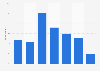
Kameda Seika Group generated more than 95 billion Japanese yen in net sales in fiscal year 2023. Kameda Seika Group was founded in 1946 and is a manufacturer and distributor of rice crackers and snacks headquartered in Niigata, Japan.
Advertisement
Advertisement
Net sales of Kameda Seika Group from fiscal year 2014
to 2023
(in billion Japanese yen)
Adjust the presentation of the statistic and data points.
Share the statistic on social media channels or embed the statistic in your
website using "Embed Code", where available.
Cite this statistic and select one of the following formats: APA, Chicago, Harvard, MLA & Bluebook.
Print the statistic including description and metadata.
Chart type
Net sales of Kameda Seika Group from fiscal year 2014
to 2023
Share this statistic
You have no right to use this feature.
Make sure to contact us if you are interested in scientific citation.
You can upgrade your account to enable this functionality for all statistics.
This feature is not available with your current account.Request access
fiscal years 2014 to 2023; the company's fiscal year starts on April 1 of the stated year and ends on March 31 of the following year
Supplementary notes
The company adopted the 'Accounting Standard for Revenue Recognition' from FY 2021. Data prior to fiscal year 2019 come from previous reports. 100 Japanese yen equal 0.64 U.S. dollars or 0.59 euros as of June 2024. Values have been rounded.
Learn more about how Statista can support your business.
Kameda Seika. (May 27, 2024). Net sales of Kameda Seika Group from fiscal year 2014
to 2023 (in billion Japanese yen) [Graph]. In Statista. Retrieved June 16, 2025, from https://www.statista.com/statistics/1304016/kameda-seika-group-net-sales/
Kameda Seika. "Net sales of Kameda Seika Group from fiscal year 2014
to 2023 (in billion Japanese yen)." Chart. May 27, 2024. Statista. Accessed June 16, 2025. https://www.statista.com/statistics/1304016/kameda-seika-group-net-sales/
Kameda Seika. (2024). Net sales of Kameda Seika Group from fiscal year 2014
to 2023 (in billion Japanese yen). Statista. Statista Inc.. Accessed: June 16, 2025. https://www.statista.com/statistics/1304016/kameda-seika-group-net-sales/
Kameda Seika. "Net Sales of Kameda Seika Group from Fiscal Year 2014
To 2023 (in Billion Japanese Yen)." Statista, Statista Inc., 27 May 2024, https://www.statista.com/statistics/1304016/kameda-seika-group-net-sales/
Kameda Seika, Net sales of Kameda Seika Group from fiscal year 2014
to 2023 (in billion Japanese yen) Statista, https://www.statista.com/statistics/1304016/kameda-seika-group-net-sales/ (last visited June 16, 2025)
Net sales of Kameda Seika Group from fiscal year 2014
to 2023 (in billion Japanese yen) [Graph], Kameda Seika, May 27, 2024. [Online]. Available: https://www.statista.com/statistics/1304016/kameda-seika-group-net-sales/
Advertisement
Profit from additional features with an Employee Account
Please create an employee account to be able to mark statistics as favorites.
Then you can access your favorite statistics via the star in the header.
Profit from the additional features of your individual account
Currently, you are using a shared account. To use individual functions (e.g., mark statistics as favourites, set
statistic alerts) please log in with your personal account.
If you are an admin, please authenticate by logging in again.