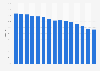
Cash money use in Australia decreased in the past years, as consumers became increasingly more cashless. This according to estimations based on the available data regarding cash withdrawals and payment transactions. No data exists on the actual use of cash money, outside of survey diaries. The numbers shown here assume that consumers who withdraw cash money are likely to spend this in a physical store. As not all payment data is readily available, like the use of OTC or over-the-counter cash withdrawals, note this can still mean that the cash share numbers provided here are not necessarily accurate.
The numbers provided have been calculated by Statista, using numbers on ATM cash withdrawals. See the "Details" tab for more information.
Supplementary notes
No data is available that covers the exact volume of transactions conducted with cash. To make a credible estimation, this calculation looked at the following indicators:
Value of ATM cash withdrawals (or general cash withdrawals, if ATM data is not available);
These are then calculated against a total that also include the following:
Value of card and e-money payments;
Value of check (cheque) transactions;
Value of direct debits;
Value of instant payments, also referred to as fast payments or real-time payments.
Profit from the additional features of your individual account
Currently, you are using a shared account. To use individual functions (e.g., mark statistics as favourites, set
statistic alerts) please log in with your personal account.
If you are an admin, please authenticate by logging in again.
Learn more about how Statista can support your business.
Statista. (March 25, 2025). Share of ATM cash relative to the flow of other domestic payments at point of sale (POS) in Australia from 2012 to 2023 [Graph]. In Statista. Retrieved July 13, 2025, from https://www.statista.com/statistics/1306763/cash-use-in-australia/
Statista. "Share of ATM cash relative to the flow of other domestic payments at point of sale (POS) in Australia from 2012 to 2023." Chart. March 25, 2025. Statista. Accessed July 13, 2025. https://www.statista.com/statistics/1306763/cash-use-in-australia/
Statista. (2025). Share of ATM cash relative to the flow of other domestic payments at point of sale (POS) in Australia from 2012 to 2023. Statista. Statista Inc.. Accessed: July 13, 2025. https://www.statista.com/statistics/1306763/cash-use-in-australia/
Statista. "Share of Atm Cash Relative to The Flow of Other Domestic Payments at Point of Sale (Pos) in Australia from 2012 to 2023." Statista, Statista Inc., 25 Mar 2025, https://www.statista.com/statistics/1306763/cash-use-in-australia/
Statista, Share of ATM cash relative to the flow of other domestic payments at point of sale (POS) in Australia from 2012 to 2023 Statista, https://www.statista.com/statistics/1306763/cash-use-in-australia/ (last visited July 13, 2025)
Share of ATM cash relative to the flow of other domestic payments at point of sale (POS) in Australia from 2012 to 2023 [Graph], Statista, March 25, 2025. [Online]. Available: https://www.statista.com/statistics/1306763/cash-use-in-australia/