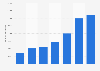
Significant fluctuations are estimated for all segments over the forecast period for the combined volume. Only in the segment Carbonated Soft Drinks, a significant increase can be observed over the forecast period. In this segment, the combined volume exhibits a difference of 145.86 million litres between 2018 and 2029.
Data provided by Statista Market Insights are estimates.
Definition:
The market Soft Drinks covers varieties of prepared water-based beverages to which flavoring additives (sugar or sweeteners, aromas etc.) have been added. These include cola drinks and lemonades, but also energy drinks, fruit nectars and soft drinks with fruit juice content, as well as value-added or flavored water. Coffee and tea-based drinks, as well as Energy & Sports Drinks are not included and are shown seperately.
Structure:
The Soft Drinks market is structured into two markets:
Carbonated Soft Drinks denote all artificially sweetened and carbonated Non-Alcoholic Drinks.
Non-Carbonated Soft Drinks contain non-alcoholic liquid refreshment beverages that are not artificially carbonated.
Additional information:
The market comprises revenue and average revenue per capita, volume and average volume per capita, price per liter, as well as sales channels. Per capita figures refer to a country’s or region’s whole population.
The at-home market covers retail sales via super- and hypermarkets, eCommerce, convenience stores, or similar sales channels. The out-of-home data encompasses all sales to hotels, restaurants, catering, cafés, bars, and similar hospitality service establishments. Combined numbers encompass both the at-home market and the out-of-home market. Both the at-home and the out-of-home market are valued at retail selling prices including all sales and consumption taxes.
Key players include The Coca-Cola Company, PepsiCo, Suntory, Red Bull, and Keurig Dr Pepper.
Profit from the additional features of your individual account
Currently, you are using a shared account. To use individual functions (e.g., mark statistics as favourites, set
statistic alerts) please log in with your personal account.
If you are an admin, please authenticate by logging in again.
Learn more about how Statista can support your business.
Statista. (April 4, 2025). Volume of soft drinks consumption in Hungary from 2018 to 2029, by segment (in million liters) [Graph]. In Statista. Retrieved May 07, 2025, from https://www.statista.com/statistics/1312247/hungary-soft-drinks-consumption-volume/
Statista. "Volume of soft drinks consumption in Hungary from 2018 to 2029, by segment (in million liters)." Chart. April 4, 2025. Statista. Accessed May 07, 2025. https://www.statista.com/statistics/1312247/hungary-soft-drinks-consumption-volume/
Statista. (2025). Volume of soft drinks consumption in Hungary from 2018 to 2029, by segment (in million liters). Statista. Statista Inc.. Accessed: May 07, 2025. https://www.statista.com/statistics/1312247/hungary-soft-drinks-consumption-volume/
Statista. "Volume of Soft Drinks Consumption in Hungary from 2018 to 2029, by Segment (in Million Liters)." Statista, Statista Inc., 4 Apr 2025, https://www.statista.com/statistics/1312247/hungary-soft-drinks-consumption-volume/
Statista, Volume of soft drinks consumption in Hungary from 2018 to 2029, by segment (in million liters) Statista, https://www.statista.com/statistics/1312247/hungary-soft-drinks-consumption-volume/ (last visited May 07, 2025)
Volume of soft drinks consumption in Hungary from 2018 to 2029, by segment (in million liters) [Graph], Statista, April 4, 2025. [Online]. Available: https://www.statista.com/statistics/1312247/hungary-soft-drinks-consumption-volume/